Oklahoma City has the advantage of playing Sunday's big contest at home, but anything can happen in Game 7.
OKLAHOMA CITY — The NBA Finals have arrived at Game 7, 48 minutes (or a few more) to determine if the Indiana Pacers or Oklahoma City Thunder will win their first NBA championship.
If the Thunder win, they will be, statistically, one of the best champions in NBA history. If the Pacers win, they’ll be one of the most unlikely teams to have raised the Larry O’Brien Trophy.
Here are seven numbers to know in advance of Game 7 on Sunday (8 ET, ABC) …
1. 15-4
Home teams are 15-4 in Game 7 of the Finals, but the last one (2016) was won by the road team. Starting with that game (and not including three Game 7s in the 2020 bubble), the road team has won 14 of the last 26 Game 7s in the playoffs.
That mark includes a 21-point win for the Pacers in Game 7 of last year’s Eastern Conference semifinals, when they shot a playoff-record 67.1% at Madison Square Garden.
The Thunder won Game 7 of this year’s Western Conference semis by 32 points, holding the Denver Nuggets to just 93 points on 101 possessions.
Six players in the series have played in multiple Game 7s …
- 3: Pascal Siakam and Myles Turner
- 2: Lu Dort, Shai Gilgeous-Alexander, Isaiah Hartenstein and Aaron Nesmith
2. 6.7
If you think Finals Game 7s tend to be uglier than the series as a whole, you’re right.
There have been four Game 7s in the Finals for which we have play-by-play data. On average, the teams have scored 6.7 fewer points per 100 possessions in those Game 7s than they did over the first six games of those series. The pace has also been an average of 2.4 possessions (per team) per 48 minutes slower.
Finals Game 7 pace & efficiency vs. first 6 games of series
| Through 6 | Game 7 | Diff. | ||||
|---|---|---|---|---|---|---|
| Year | OffRtg | Pace | OffRtg | Pace | OffRtg | Pace |
| 2005 | 103.3 | 83.0 | 100.0 | 77.5 | -3.3 | -5.5 |
| 2010 | 102.9 | 87.6 | 94.2 | 86.0 | -8.8 | -1.6 |
| 2013 | 108.2 | 89.4 | 100.0 | 91.5 | -8.2 | +2.1 |
| 2016 | 108.6 | 93.6 | 102.2 | 89.0 | -6.4 | -4.6 |
| TOTAL | 105.8 | 88.4 | 99.1 | 86.0 | -6.7 | -2.4 |
OffRtg = Points scored per 100 possessions
Pace = Possessions (per team) per 48 minutes
Of course, slower pace and lower efficiency leads to a greater likelihood that the game will be close. The last eight Game 7s of the Finals have all been determined by single digits.
The Thunder and Pacers have averaged 110.0 points per 100 possessions and 99.8 possessions (per team) per 48 minutes through the first six games, so we should expect to see something closer to a point per possession in Game 7.
The Pacers have won the two ugliest games of the Finals: Game 1 (107.8 combined per 100) and Game 6 (98.5), and are 2-6 in the playoffs (2-2 in this series) when they’ve scored fewer than 110 points per 100 possessions.
The Thunder are 1-6 when they’ve scored fewer than 110 per 100, with their one win being Game 4 in Denver. Six of those seven games have been on the road, with the one exception being their Game 1 of the Finals.
3. 19.4
The Thunder have scored 19.4 more points per 100 possessions in their three wins in the Finals (120.4) than they have in their three losses (101.0). That end of the floor has been much more determinative than the Pacers’ offense (110.6 vs. 108.5 per 100).
“Our defense has been more consistent, in these playoffs especially,” Thunder coach Mark Daigneault said Saturday, “than our offense has.”
It’s a make-or-miss league and three Thunder role players — Alex Caruso, Aaron Wiggins and Cason Wallace — have shot much better in the three wins (combined effective field goal percentage of 59.8%) than they have in the three losses (39.0%).
But those three haven’t taken a ton of shots, and overall, the difference in the Thunder’s effective field goal percentage in their wins (52.2%) vs. their losses (48.4%) isn’t huge. Just as important has been a lower turnover rate (13.9 vs. 15.4 per 100 possessions), a higher free throw rate (40.6 vs. 31.9 attempts per 100 shots from the field) and a higher offensive rebounding percentage (36.4% vs. 24.3%).
4. 32.9%
The Thunder have taken only 32.9% of their shots from 3-point range. That’s the lowest rate for any team in any series in these playoffs and a drop from their rate of 40.6% through the first three rounds. Over the six games, they’ve been outscored by 54 points from 3-point range.
The much bigger drop has been with their catch-and-shoot attempts, from 28.5 per game (third among the 16 playoff teams) through the first three rounds to just 20.2 per game in the Finals.
5. 705
Over the six games, the Pacers have thrown 705 more passes than the Thunder, according to Second Spectrum tracking.
A big reason the Thunder have seen a big drop in catch-and-shoot opportunities is that they’ve seen a huge drop in ball movement from the first three rounds, throwing 65 fewer passes per 24 minutes of possession.
The Pacers meanwhile, have moved the ball more than they did through the conference finals, after which they ranked second in ball movement (just a tick behind the Golden State Warriors) in the playoffs.
Passes per 24 minutes of possession, Finals vs. first 3 rounds
| Thunder | Pacers | |||||
|---|---|---|---|---|---|---|
| Series | TOP | Passes | Pass/24 | TOP | Passes | Pass/24 |
| First 3 rounds | 319.0 | 4,105 | 309 | 332.0 | 5,029 | 364 |
| Finals | 129.1 | 1,311 | 244 | 125.6 | 2,016 | 385 |
| Diff. | -65 | +22 | ||||
TOP = Minutes of possession
Pass/24 = Passes per 24 minutes of possession
Gilgeous-Alexander and Jalen Williams have passed on 29% of their drives, down from 39% through the first three rounds. They have more turnovers (13) than assists (10) on those drives.
Over the last four games, the Thunder, as a team, have 65 assists and 67 turnovers. The three games in Indiana (Games 3, 4 and 6) came with their three lowest assist-turnover ratios of the season (104 total games).
6. 35
Though their free-throw rate has been much higher in their wins than in their losses (see above), the Thunder have still outscored the Pacers at the free-throw line in all six games and by a total of 35 points (154-119). In fact, the Pacers have been outscored at the line in 14 of their last 16 games.
That’s more about their defense than their offense. In the playoffs, their opponent free throw rate is 33.6 attempts per 100 shots from the field, the highest opponent rate for any team that’s played beyond the first round in the last 10 postseasons.
Among 96 players who’ve played at least 150 minutes in these playoffs, Thomas Bryant (5.4), Nesmith (5.2) and Ben Sheppard (4.7) rank first, second and fifth in fouls per 36 minutes.
7. 51:29
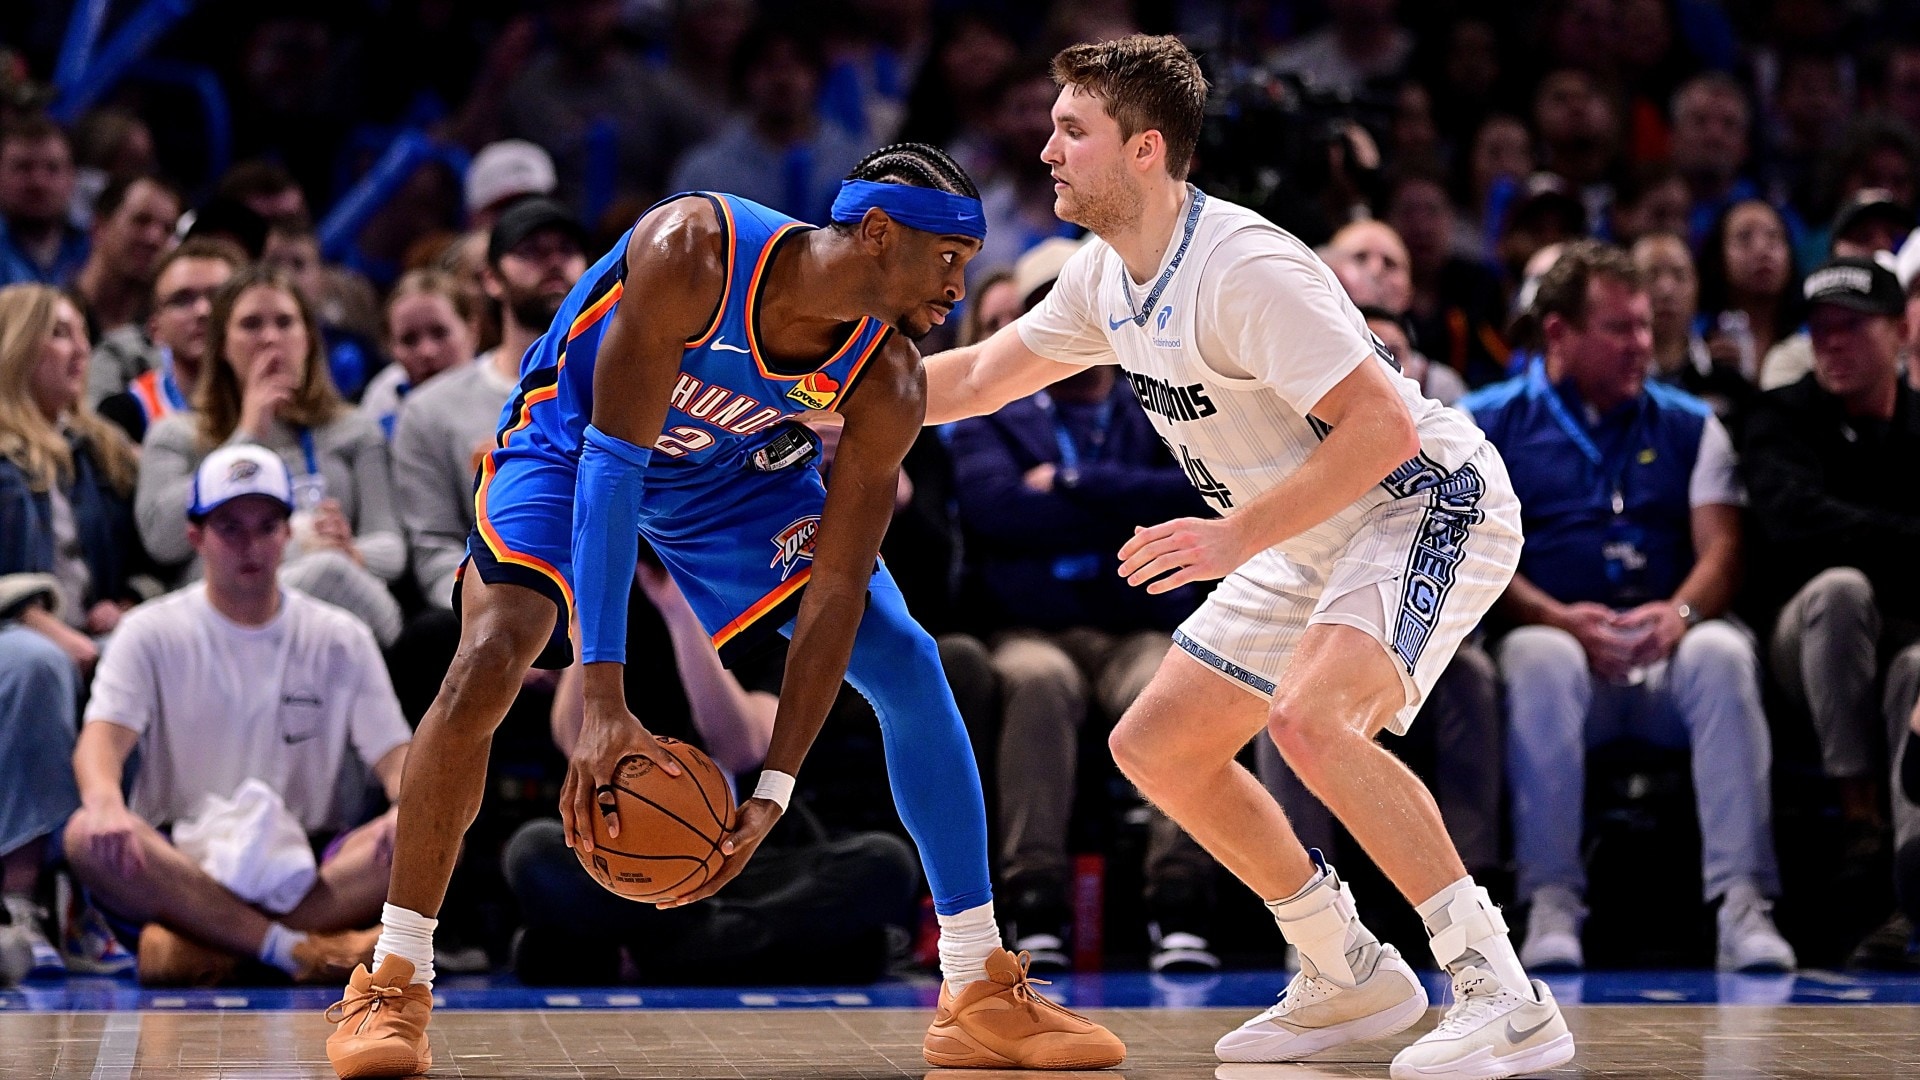
Andrew Nembhard has defended Gilgeous-Alexander for 51 minutes and 29 seconds over the six games. That’s 18:31 more than any other player has defended any opponent in this series. (Next most is Dort defending Haliburton for 32:58.)
It’s the most important matchup for either team in this series and should continue to be so in Game 7, though according to Second Spectrum …
- The Pacers have been more aggressive in sending double-teams at Gilgeous-Alexander over the past four games (30% of his touches) than they were over the first two (18%).
- They’ve switched a higher percentage of his ball screens and handoffs in the last two games (16%) than they did over the first four (7%).
The spotlight will be on the series MVP on Sunday, and it’s the Thunder’s offense that has determined Games 1-6. But anything on either end of the floor could swing Game 7 and, ultimately, the championship.
* * *
John Schuhmann is a senior stats analyst for NBA.com. You can e-mail him here, find his archive here and follow him on X.
The views on this page do not necessarily reflect the views of the NBA, its clubs or Warner Bros. Discovery.


