The Association shares why the Hornets can make some noise in the postseason.
The Charlotte Hornets have been one of the best stories in the league.
They’ve missed the playoffs in each of the last nine seasons, both the league’s longest active drought and the longest in Eastern Conference history. And with a 16-28 record (12th in the East) through Jan. 21, they were on their way to extending that drought to 10 years.
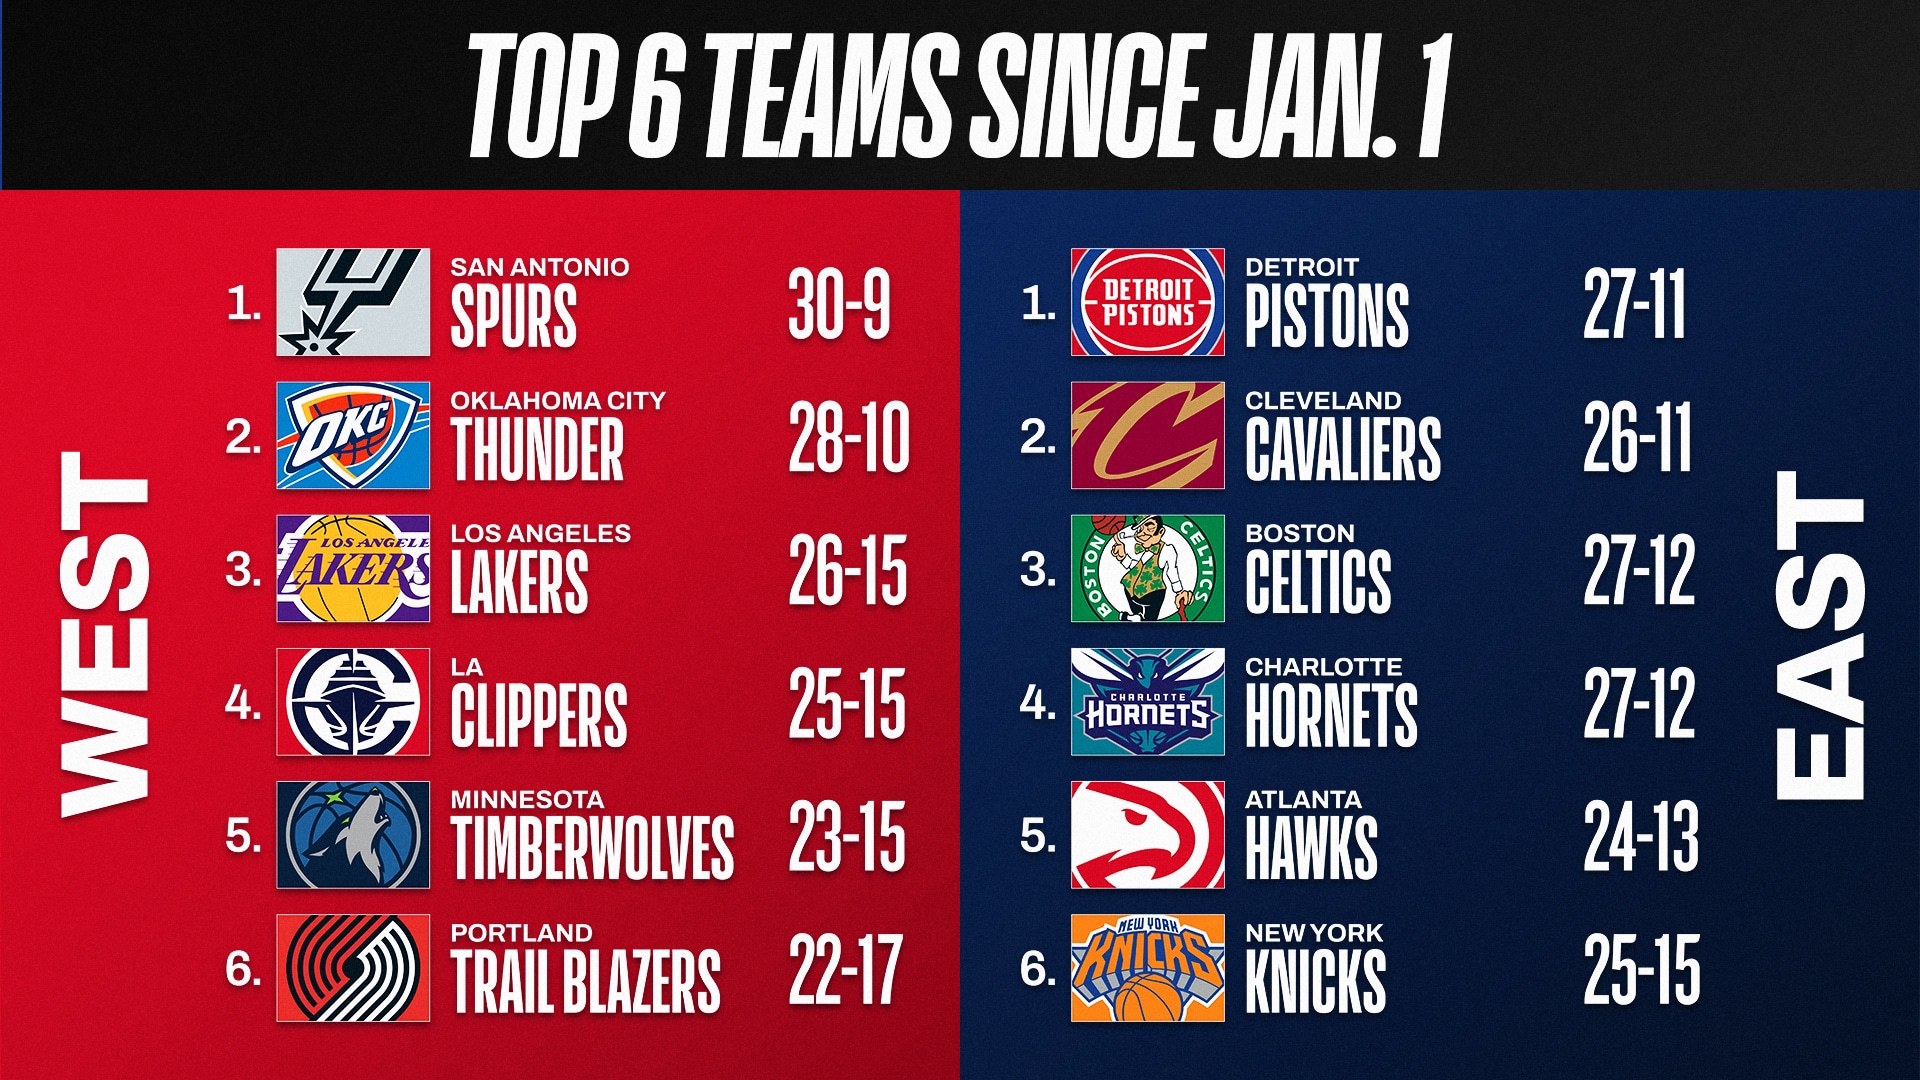
The Hornets are still just in ninth place after Wednesday’s games, so ending that drought isn’t guaranteed. But they’ve gone 22-6 (only the Spurs have been better) since that 16-28 start and are now four games over .500 for the first time.
Statistically, the Hornets are much better than that. They’re one of the most improved teams we’ve ever seen, and they may be a sleeping giant in the Eastern Conference.
1. Some historical improvement
Even with that 16-28 start, the Hornets have outscored their opponents by 4.7 points per 100 possessions, the league’s sixth-best mark. That’s also an improvement from being outscored by 9.1 per 100 (fourth worst) last season.
That jump of 13.8 points per 100 possessions is the second biggest season-to-season improvement in the 30 years for which we have play-by-play data.
Biggest season-to-season improvement, point diff. per 100 possessions, since 1997
| Team | Season | Prev. | Rank | NetRtg | Rank | Diff. |
|---|---|---|---|---|---|---|
| Boston | 2007-08 | -3.5 | 24 | +10.8 | 1 | 14.3 |
| Charlotte | 2025-26 | -9.1 | 27 | +4.7 | 6 | 13.8 |
| San Antonio | 1997-98 | -8.8 | 28 | +4.4 | 8 | 13.2 |
| Memphis | 2024-25 | -6.9 | 26 | +4.7 | 6 | 11.6 |
| Detroit | 2024-25 | -9.0 | 29 | +2.1 | 12 | 11.1 |
| Phoenix | 2004-05 | -3.8 | 24 | +7.0 | 2 | 10.8 |
| San Antonio | 2025-26 | -2.8 | 22 | +8.0 | 2 | 10.8 |
| Cleveland | 2021-22 | -8.3 | 28 | +2.1 | 13 | 10.4 |
| Cleveland | 2008-09 | -0.6 | 16 | +9.6 | 1 | 10.2 |
| Philadelphia | 2017-18 | -5.5 | 27 | +4.6 | 4 | 10.1 |
Prev. = Previous season NetRtg
NetRtg = Point differential per 100 possessions
Through Mar. 25, 2026
As things stand through Wednesday, the biggest season-to-season improvements of the last 30 years came from …
- A team that traded for Ray Allen and Kevin Garnett. (2007-08 Celtics)
- A team that drafted Tim Duncan and got David Robinson back from injury. (1997-98 Spurs)
- The 2025-26 Hornets.
And the Hornets aren’t third on the list!
The improvement has been mostly on offense, where the Hornets have scored 11.5 more points per 100 possessions than last season, more than double the improvement of any other team on that end of the floor. (Orlando is next, having scored 5.6 more per 100 than it did last season.)
But the Hornets also rank as the league’s fifth-most improved defensive team, having allowed 2.2 fewer points per 100 possessions than last season. And rebounding has been critical on both ends of the floor. The Hornets are the only team that ranks in the top five in both offensive and defensive rebounding percentage, having ranked eighth and 17th last season.
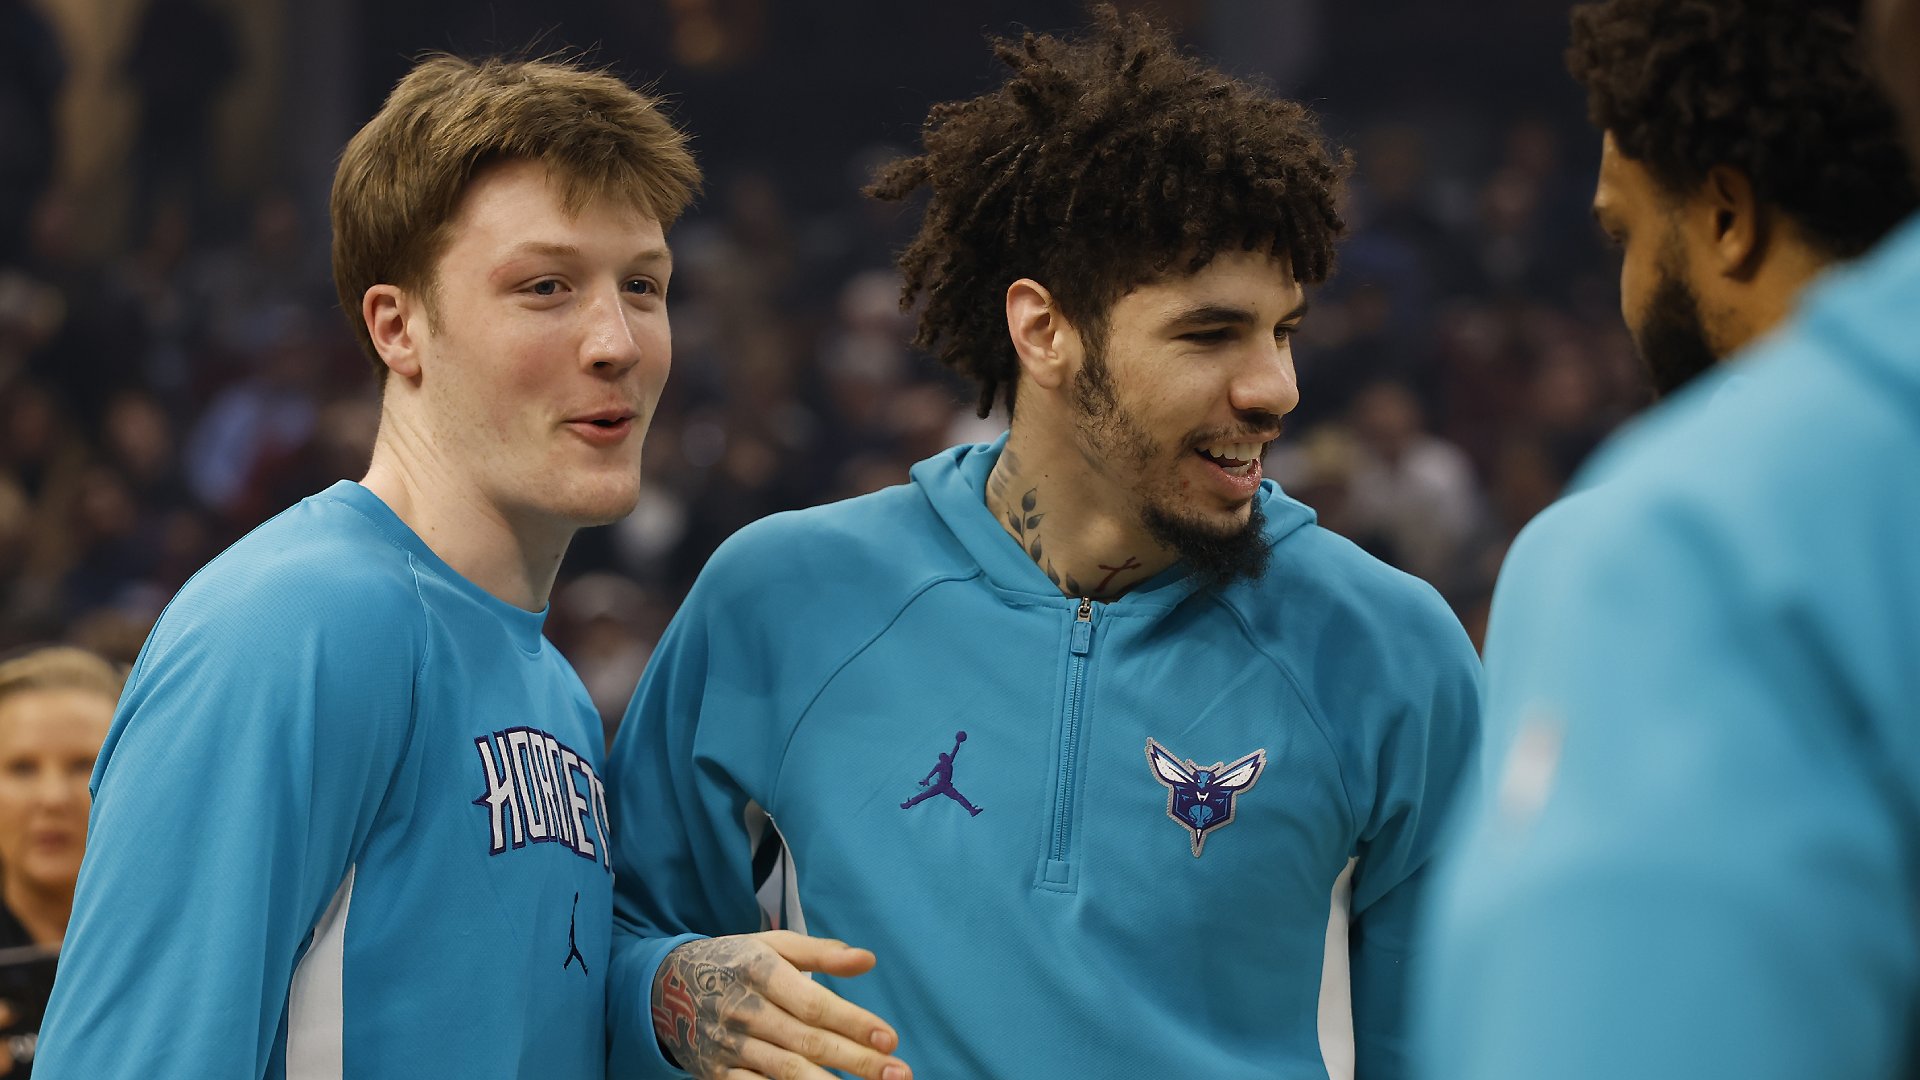
Health has been key. LaMelo Ball has played in 62 games after averaging only 35 over the previous three seasons. He and Brandon Miller have played more minutes together this season (1,034) than they did over Miller’s first two seasons in the league (827).
But it’s obviously not just the amount of minutes that they’ve played together, because the Hornets have been much, much better in those Ball-and-Miller minutes than they were previously…
Hornets with LaMelo Ball and Brandon Miller on the floor together
| Season | GP | MIN | OffRtg | DefRtg | NetRtg |
|---|---|---|---|---|---|
| 2023-24 | 19 | 361 | 113.6 | 119.1 | -5.5 |
| 2024-25 | 20 | 466 | 114.1 | 113.7 | +0.5 |
| 2025-26 | 52 | 1,034 | 126.6 | 112.9 | +13.7 |
OffRtg = Points scored per 100 possessions
DefRtg = Points allowed per 100 possessions
NetRtg = Point differential per 100 possessions
Through Mar. 25, 2026
2. A historically good lineup
Kon Knueppel, Miles Bridges and Moussa Diabaté have also been on the floor for 404 of those 1,034 Ball-and-Miller minutes. The Hornets have outscored their opponents by an amazing 28.5 points per 100 possessions in those 404 minutes with all five starters on the floor.
That would be the best mark for any five-man group that’s played at least 250 total minutes in the 19 seasons for which we have lineup data.
The starters have beaten up on some bad teams. Of those 404 minutes, 156 (39%) have come against the bottom 10 teams in the league, and the Hornets have somehow outscored those teams by 175 points in those 156 minutes.
But they’ve also been very good against the middle of the pack and have outscored the 10 best teams in the league by a single point in 118 minutes with the five starters on the floor together…
Hornets starters vs. top 10, middle 10, bottom 10 teams
| Opponents | MIN | OffRtg | DefRtg | NetRtg | +/- |
|---|---|---|---|---|---|
| vs. Top 10 | 118 | 127.5 | 128.2 | -0.7 | +1 |
| vs. Middle 10 | 129 | 128.6 | 104.9 | +23.8 | +65 |
| vs. Bottom 10 | 156 | 147.9 | 94.6 | +53.3 | +175 |
OffRtg = Points scored per 100 possessions
DefRtg = Points allowed per 100 possessions
NetRtg = Point differential per 100 possessions
Through Mar. 25, 2026
3. The record doesn’t tell it all
While the Hornets are in ninth place, they’ve outscored their opponents by 4.6 points per game, the league’s sixth-best point differential. It’s the point differential of a team that’s 48-24.
Statistically, the Hornets are 10 games better than their record says they are. There have been only 11 other teams in NBA history (the 2021-22 Celtics were the last) that had a differential of at least 10 games between their “expected” wins and their actual wins.
The Hornets’ 38 wins have come by an average of 18.1 points. That isn’t just the biggest average margin of victory in the league this season, it’s the biggest in NBA history.
Largest average margin of victory (in wins), NBA history
| Team | Season | W | L | PCT | MOV | MOD |
|---|---|---|---|---|---|---|
| Charlotte | 2025-26 | 38 | 34 | .528 | 18.1 | -10.5 |
| Milwaukee | 1970-71 | 66 | 16 | .805 | 17.5 | -9.5 |
| Oklahoma City | 2024-25 | 68 | 14 | .829 | 17.3 | -8.9 |
| Boston | 2021-22 | 51 | 31 | .622 | 16.9 | -8.6 |
| Philadelphia | 2011-12 | 35 | 31 | .530 | 16.8 | -9.9 |
MOV = Average point differential in wins
MOD = Average point differential in losses
Through Mar. 25, 2026
Their 34 losses have come by an average of 10.5 points, the league’s eighth smallest margin of defeat this year. The Hornets are just 10-17 (worst among the 20 teams in playoff or SoFi Play-In Tournament position) in games that were within five points in the last five minutes.
They have the league’s fifth-ranked offense overall, but have scored just 102.8 points per 100 possessions (sixth worst) with the score within five in the last five. Their four perimeter starters have combined to shoot 16-for-69 (23%) on clutch 3-pointers.
As is the case with their starting lineup, the huge point differential comes, in part, from the Hornets beating up on some bad teams. Their two biggest wins of the season (by 55 and 44 points) have come against the Jazz and Kings. In total, 14 of their 26 double-digit wins have come against the bottom 10 teams in the league.
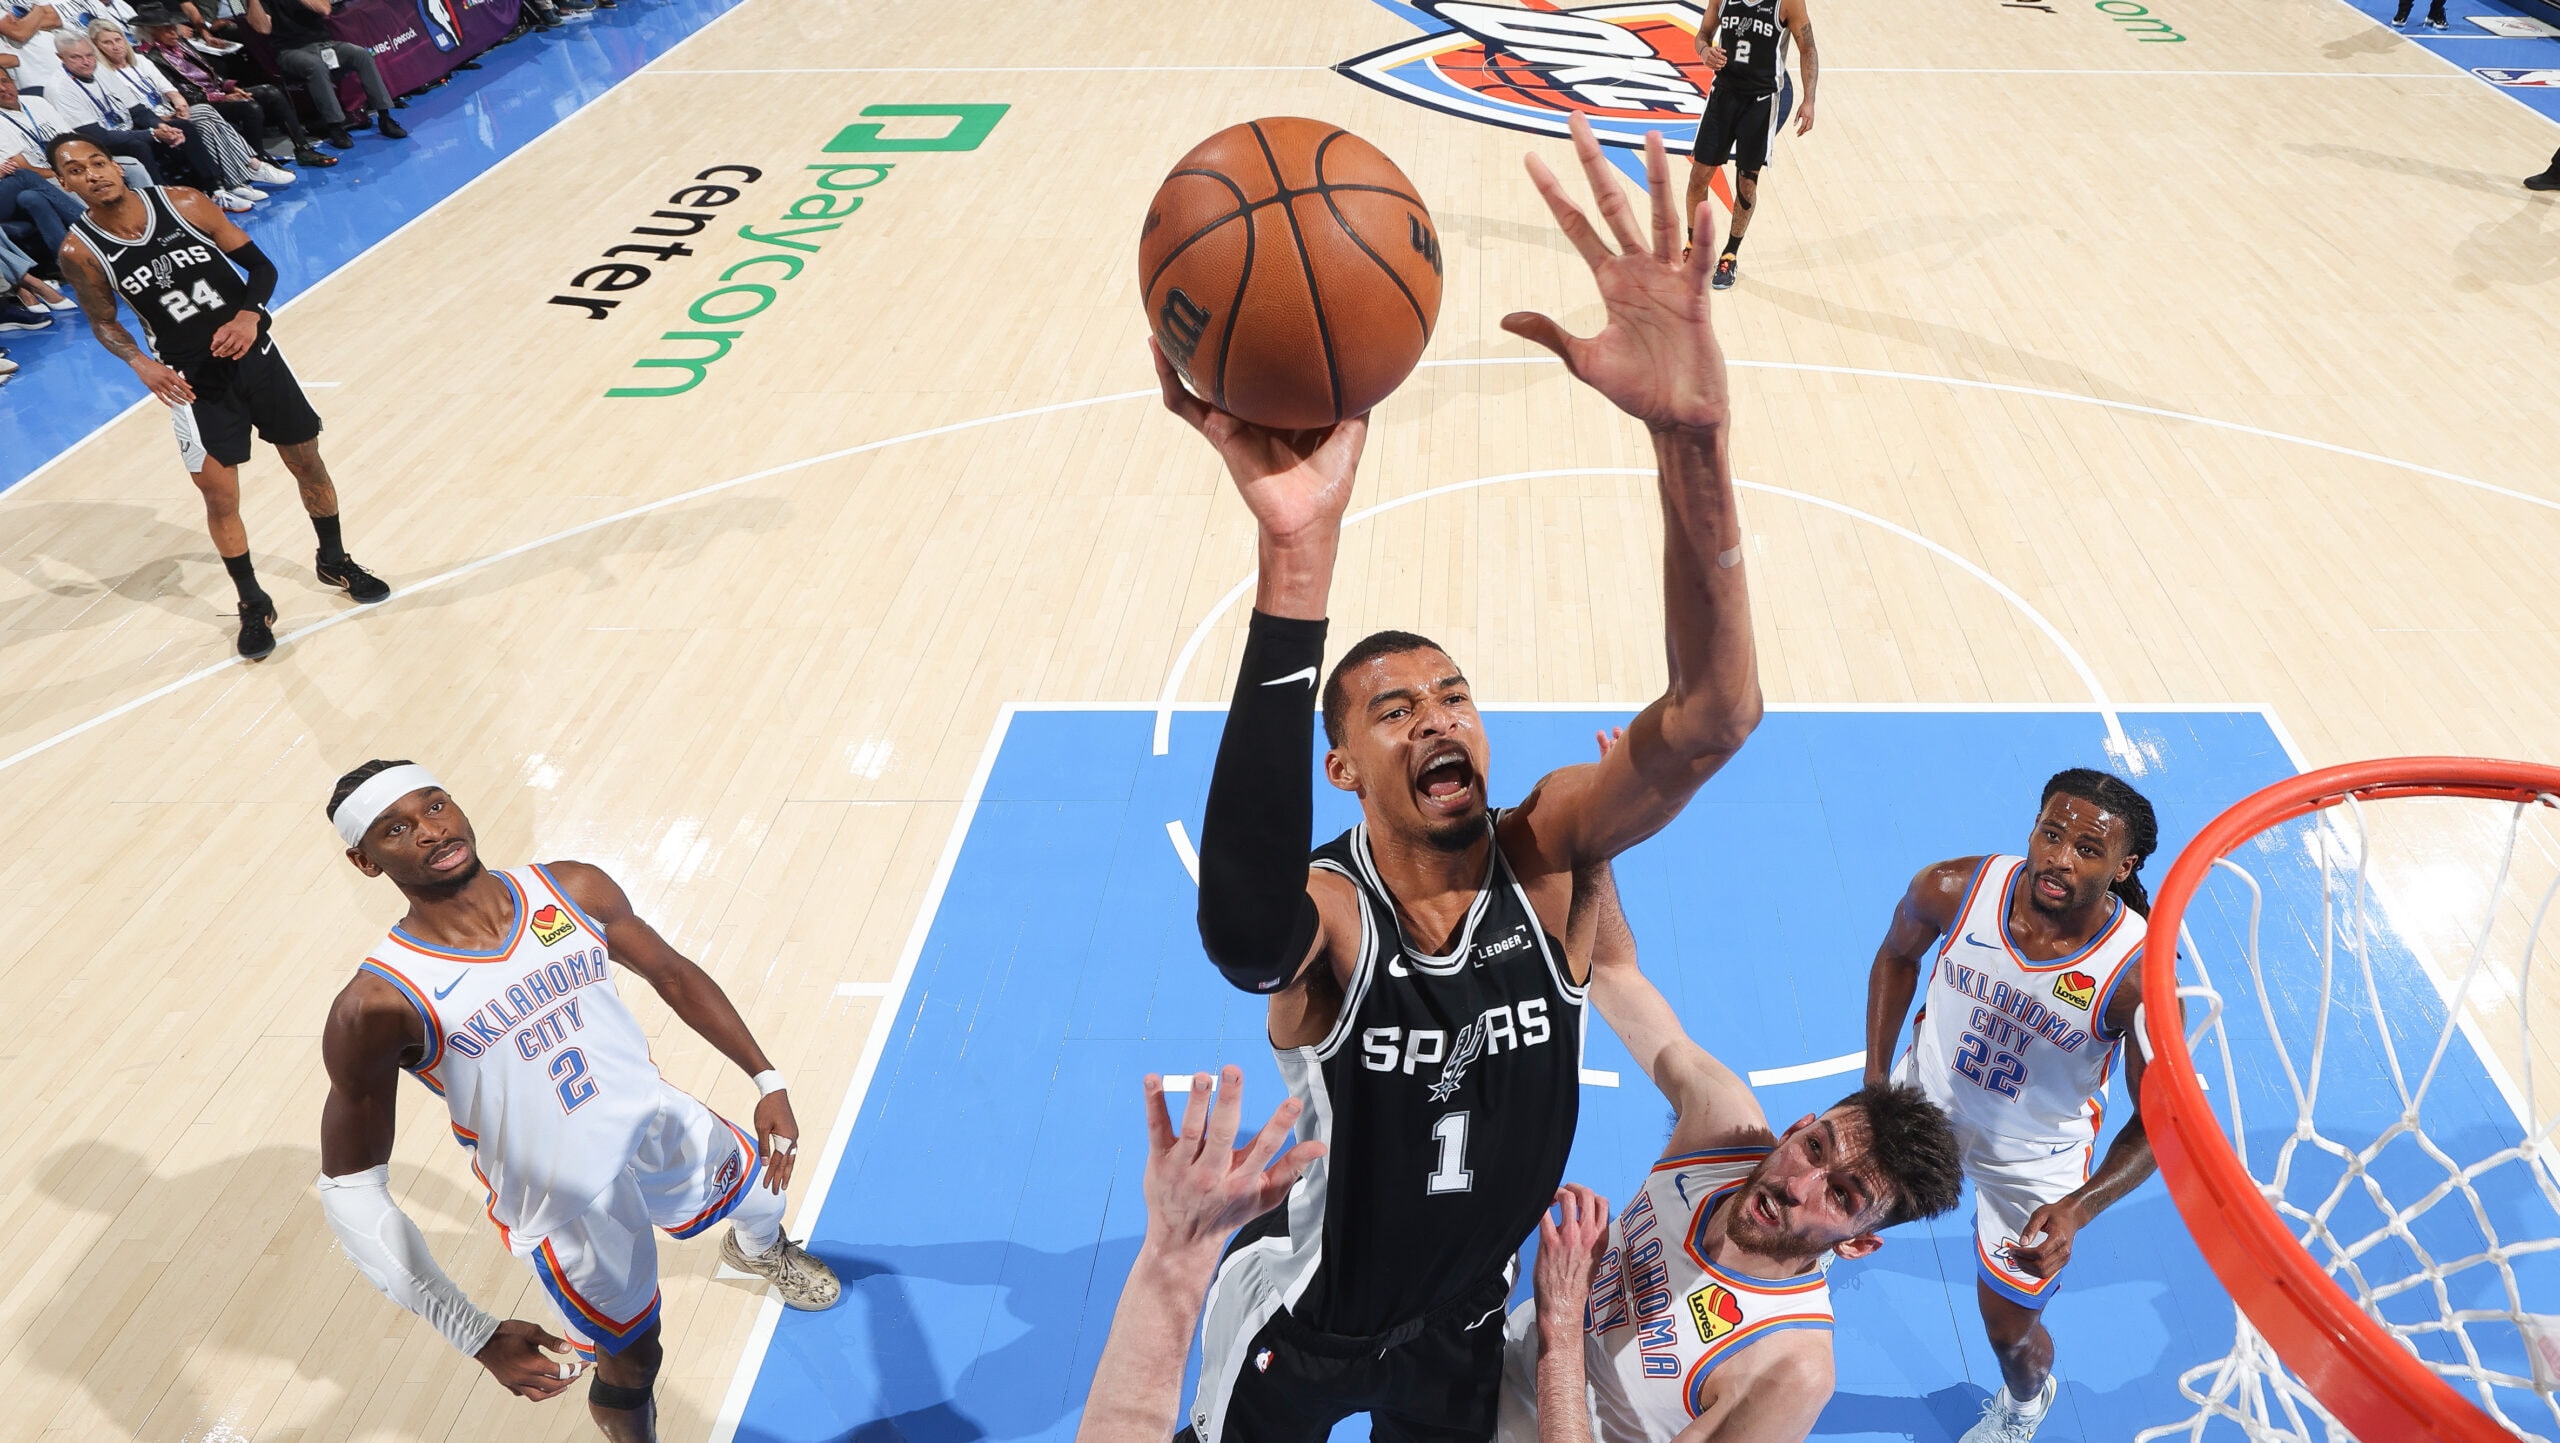
But they also have blowout wins in Oklahoma City and Boston. The Hornets have the 14th-best record (17-24) and the ninth-best point differential (plus-0.6 per game) in games played between the 18 teams with winning records through Wednesday.
Beating bad teams by a lot also matters. Point differential is a strong indicator of future success and history tells us that teams like the Hornets (worse in clutch games than they are otherwise) are more likely to overachieve in the playoffs than teams with the opposite profile.
4. Can they end the drought?
As good as they’ve been over the last two months, the Hornets are still outside the top eight in the Eastern Conference. (They’ve been to the Play-In twice in Ball’s previous five seasons, and they lost their two Play-In games by 27 and 29 points.)
Of the six teams in the 5-10 tier in the East, Charlotte has the toughest remaining schedule, with eight of its 10 games against teams currently over .500, and with a stretch of five games in seven days beginning Saturday.
Remaining schedules, East 5-10
| Team | OppPCT | O | U | H | R | Adj. SOS | |
|---|---|---|---|---|---|
| 5. | Atlanta | .531 | 7 | 2 | 4 | 5 | +1.5 |
| 6. | Toronto | .481 | 6 | 4 | 6 | 4 | -0.4 |
| 7. | Philadelphia | .512 | 6 | 3 | 3 | 6 | +1.1 |
| 8. | Miami | .466 | 6 | 3 | 4 | 5 | -0.9 |
| 9. | Charlotte | .553 | 8 | 2 | 6 | 4 | +2.5 |
| 10. | Orlando | .499 | 6 | 4 | 5 | 5 | -0.2 |
OppPCT = Cumulative opponent winning percentage
O | U = Games vs. teams currently over or under .500
H | R = Home and road games
Adj. SOS = Average opponent NetRtg, adjusted for location and rest (higher is tougher)
The Hornets are 9-6 (tied for fifth best) in games played between the top 17 teams over this greater, 22-6 stretch. And it’s possible that one or two of those eight remaining games against good teams won’t mean anything to their opponent.
Five of those eight remaining games against winning teams are against the top three teams in the East, potential playoff previews. The Hornets are just 1-4 against the Pistons, Celtics and Knicks, but their last game against the top three (Mar. 4) was a 29-point win in Boston when Charlotte was playing the second game of a back-to-back.
The Hornets have two more games against New York, with the first two meetings happening around Thanksgiving.
The first of the remaining two is Thursday in Charlotte (7 p.m. ET, NBA League Pass).
* * *
John Schuhmann has covered the NBA for more than 20 years. You can e-mail him here, find his archive here and follow him on Bluesky.