The Celtics are among the East elite this season, but are 13-16 in clutch games in 2025-26.
The Boston Celtics are 46-23 and have outscored their opponents by 8.1 points per 100 possessions, the league’s second-best mark.
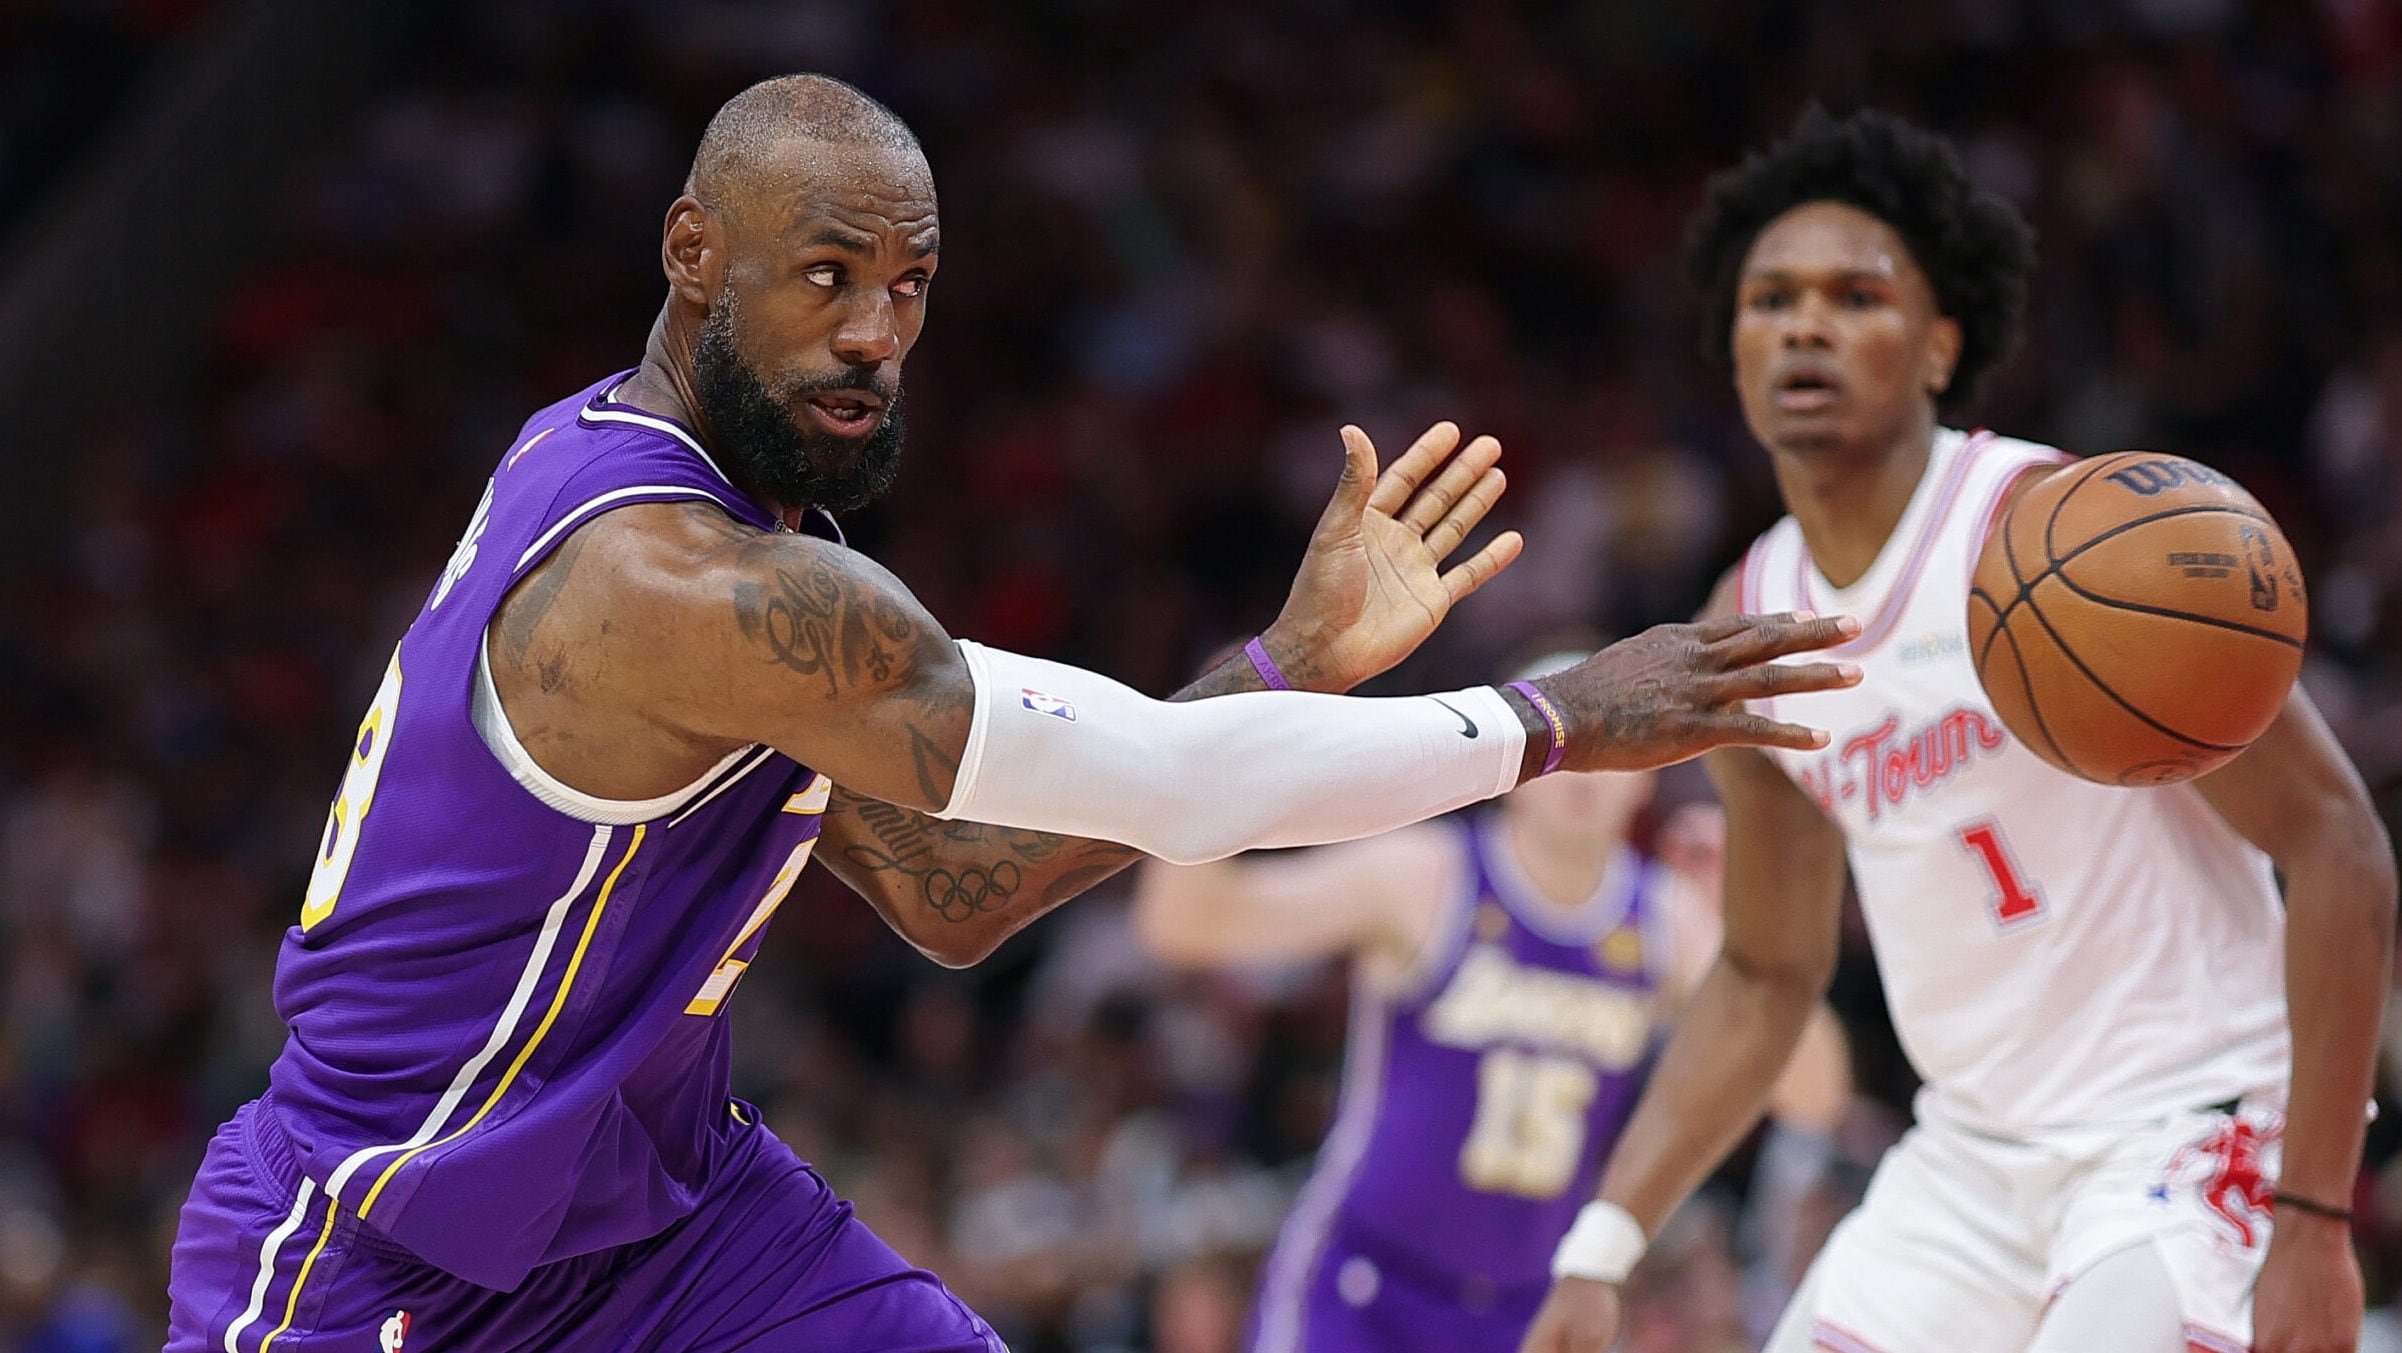
The Los Angeles Lakers are only two games worse (44-25), but have outscored their opponents by only 1.2 points per 100 (which ranks 14th).
That’s a pretty big discrepancy, and it comes, in part, from how well the Celtics and Lakers have performed in close games. The Lakers have the league’s best record (20-6) in games that were within five points in the last five minutes, a mark that includes two straight (and important) clutch wins in Houston this week. The Celtics are just 13-16 (20th) in games that were within five in the last five.
Overall point differential means a lot, and clutch numbers are small sample sizes that can be affected by good or bad luck. But a team’s ability to execute in late-game situations certainly matters and could portend a similar ability to execute in playoff situations.
But which teams actually do better in the postseason, those like the Lakers, who’ve been better in clutch situations than they’ve been otherwise, or those like the Celtics, who have been better overall than they’ve been in close games?
1. Different paths to the playoffs
How far can the Lakers go in the West playoffs?
Here are the teams, starting with the Celtics, that haven’t been great in the clutch, but have been much better otherwise this season …
Biggest discrepancy, clutch vs. non-clutch records, 2025-26
| Clutch | Non-clutch | ||||||||
|---|---|---|---|---|---|---|---|---|---|
| Team | W | L | PCT | Rank | W | L | PCT | Rank | Diff. |
| Boston | 13 | 16 | .448 | 20 | 33 | 7 | .825 | 2 | -.377 |
| Houston | 18 | 20 | .474 | 18 | 23 | 7 | .767 | 5 | -.293 |
| Denver | 17 | 19 | .472 | 19 | 25 | 9 | .735 | 6 | -.263 |
| Cleveland | 17 | 18 | .486 | 17 | 25 | 9 | .735 | 6 | -.250 |
| Charlotte | 10 | 17 | .370 | 26 | 25 | 17 | .595 | 10 | -.225 |
Clutch = Games that were within five points in the last five minutes
Non-clutch = Games that weren’t within five points in the last five minutes
Through Mar. 18, 2026
The other end of that list is mostly filled with bad teams, which makes sense. The Wizards are 12-12 in games within five points in the last five minutes, but 4-40 otherwise. After Washington, it’s the Sacramento Kings, Milwaukee Bucks, Chicago Bulls and Utah Jazz.
Among the 20 teams currently in playoff or Play-In position, it’s the Lakers followed by the Orlando Magic …
Biggest differential, clutch vs. non-clutch records, 2025-26
| Clutch | Non-clutch | ||||||||
|---|---|---|---|---|---|---|---|---|---|
| Team | W | L | PCT | Rank | W | L | PCT | Rank | Diff. |
| Los Angeles Lakers | 20 | 6 | .769 | 1 | 24 | 19 | .558 | 14 | .211 |
| Orlando | 23 | 12 | .657 | 5 | 15 | 18 | .455 | 20 | .203 |
| Toronto | 21 | 12 | .636 | 6 | 18 | 17 | .514 | 17 | .122 |
| Philadelphia | 21 | 16 | .568 | 9 | 16 | 16 | .500 | 18 | .068 |
| Portland | 19 | 20 | .487 | 16 | 15 | 16 | .484 | 19 | .003 |
Clutch = Games that were within five points in the last five minutes
Non-clutch = Games that weren’t within five points in the last five minutes
Through Mar. 18, 2026
The Magic have actually allowed more points per 100 clutch possessions than they’ve scored, meaning that they’ve entered clutch time with a lead more often than not. Two weeks ago against Dallas, they lost a 10-point, fourth-quarter lead and were outscored (15-12) on clutch possessions, but pulled out the win on Wendell Carter Jr.’s dunk with 1.4 seconds left.
2. More likely to overachieve in the playoffs?
Last season, the Minnesota Timberwolves were the team in the Celtics’ position: they were 20-26 in games within five points in the last five minutes, but 29-7 (second-best in the West) otherwise. They were the No. 6 seed, but had a much better point differential than the third-seeded Lakers. Not only did they beat the Lakers in the first round, but they reached the Western Conference Finals.
The Wolves overachieved given their playoff seeding, winning two more series than they were supposed to. That follows a pattern: over the 29 seasons (before this one) for which we have play-by-play data, teams like last season’s Wolves and this year’s Celtics are more likely to overachieve in the playoffs than teams like the Lakers.
Over those 29 years, of the 75 playoff teams with the biggest differentials between their record in non-clutch games and their record in clutch games (like the Celtics) …
- Twenty-six overachieved in the playoffs, winning more series than expected, based on their seed/overall record.
- Sixteen underachieved in the playoffs, winning fewer series than expected.
Of the 75 playoff teams with the biggest differentials between their record in clutch games and their record otherwise (like the Magic and Lakers) …
- Only eight overachieved in the playoffs.
- Ten underachieved in the playoffs
3. It’s better to be better in games that aren’t close
One of those eight teams that overachieved after having a better clutch record than they did otherwise was last season’s Indiana Pacers. In fact, the last three teams that lost in the Finals — the 2022-23 Heat, ’23-24 Mavs and ’24-25 Pacers — all had better clutch records than non-clutch records in the regular season.
But every NBA champion in the 29 seasons for which we have clutch data was better in non-clutch games in the regular season.
Regular season clutch profiles, playoff teams, 1997-2025
| Round | TOTAL | Better non | %BN | %W Clutch |
|---|---|---|---|---|
| Champion | 29 | 29 | 100% | 38% |
| Runner up | 29 | 21 | 72% | 47% |
| Conf. finals | 58 | 53 | 91% | 46% |
| Conf. semis | 116 | 89 | 77% | 48% |
| First round | 232 | 148 | 64% | 51% |
Better non = No. of teams that were better in non-clutch games in the regular season
% BN = Percentage of teams that were better in non-clutch games in the regular season
% W Clutch = Percentage of regular-season wins that were in clutch games
It shouldn’t surprise that the best teams were better in games that weren’t close than in the ones that were determined by a possession or two. Results in the latter can be random, and, even over a full season, clutch sample sizes are small. The Lakers have actually played the second-fewest clutch games of any team. Additionally, their top-ranked clutch offense has scored 221 points on 170 possessions (which is less than two full basketball games).
Clutch success can be fleeting. After winning their first 13 games that were within five points in the last five minutes, the Lakers are a more-average 7-6 in the clutch since early January.
4. Does clutch carry over to the playoffs?
Playoff clutch numbers provide even smaller sample sizes. The most clutch field goal attempts any team has attempted in a single postseason over the last 29 years is 126, a little more than one full game of shots.
There is a small correlation between teams’ clutch records in the regular season and their clutch record in the playoffs, but it’s not significant.
The team with the best clutch regular-season record (30-4) in the last 29 years was the 2015-16 Warriors, who had almost as many clutch losses (6-3) in the playoffs and lost a clutch Game 7 in the NBA Finals. The team with the second-best clutch record (32-6) was the 2006-07 Mavs, who went 1-2 in the clutch while losing in the first round to the No. 8-seeded “We Believe” Warriors.
In 2011-12 (a lockout-shortened season), the Sixers went 7-20 in clutch games and were the No. 8 seed in the East with the conference’s third-best point differential. They proceeded to win almost as many clutch games in the playoffs (6-2) as they did in the regular season, losing in Game 7 of the East semis.
Every team wants to execute at the highest level in the most high-leverage situations. But a surer sign of a great team avoids those high-leverage situations while still winning a lot of games.
* * *
John Schuhmann has covered the NBA for more than 20 years. You can e-mail him here, find his archive here and follow him on Bluesky.