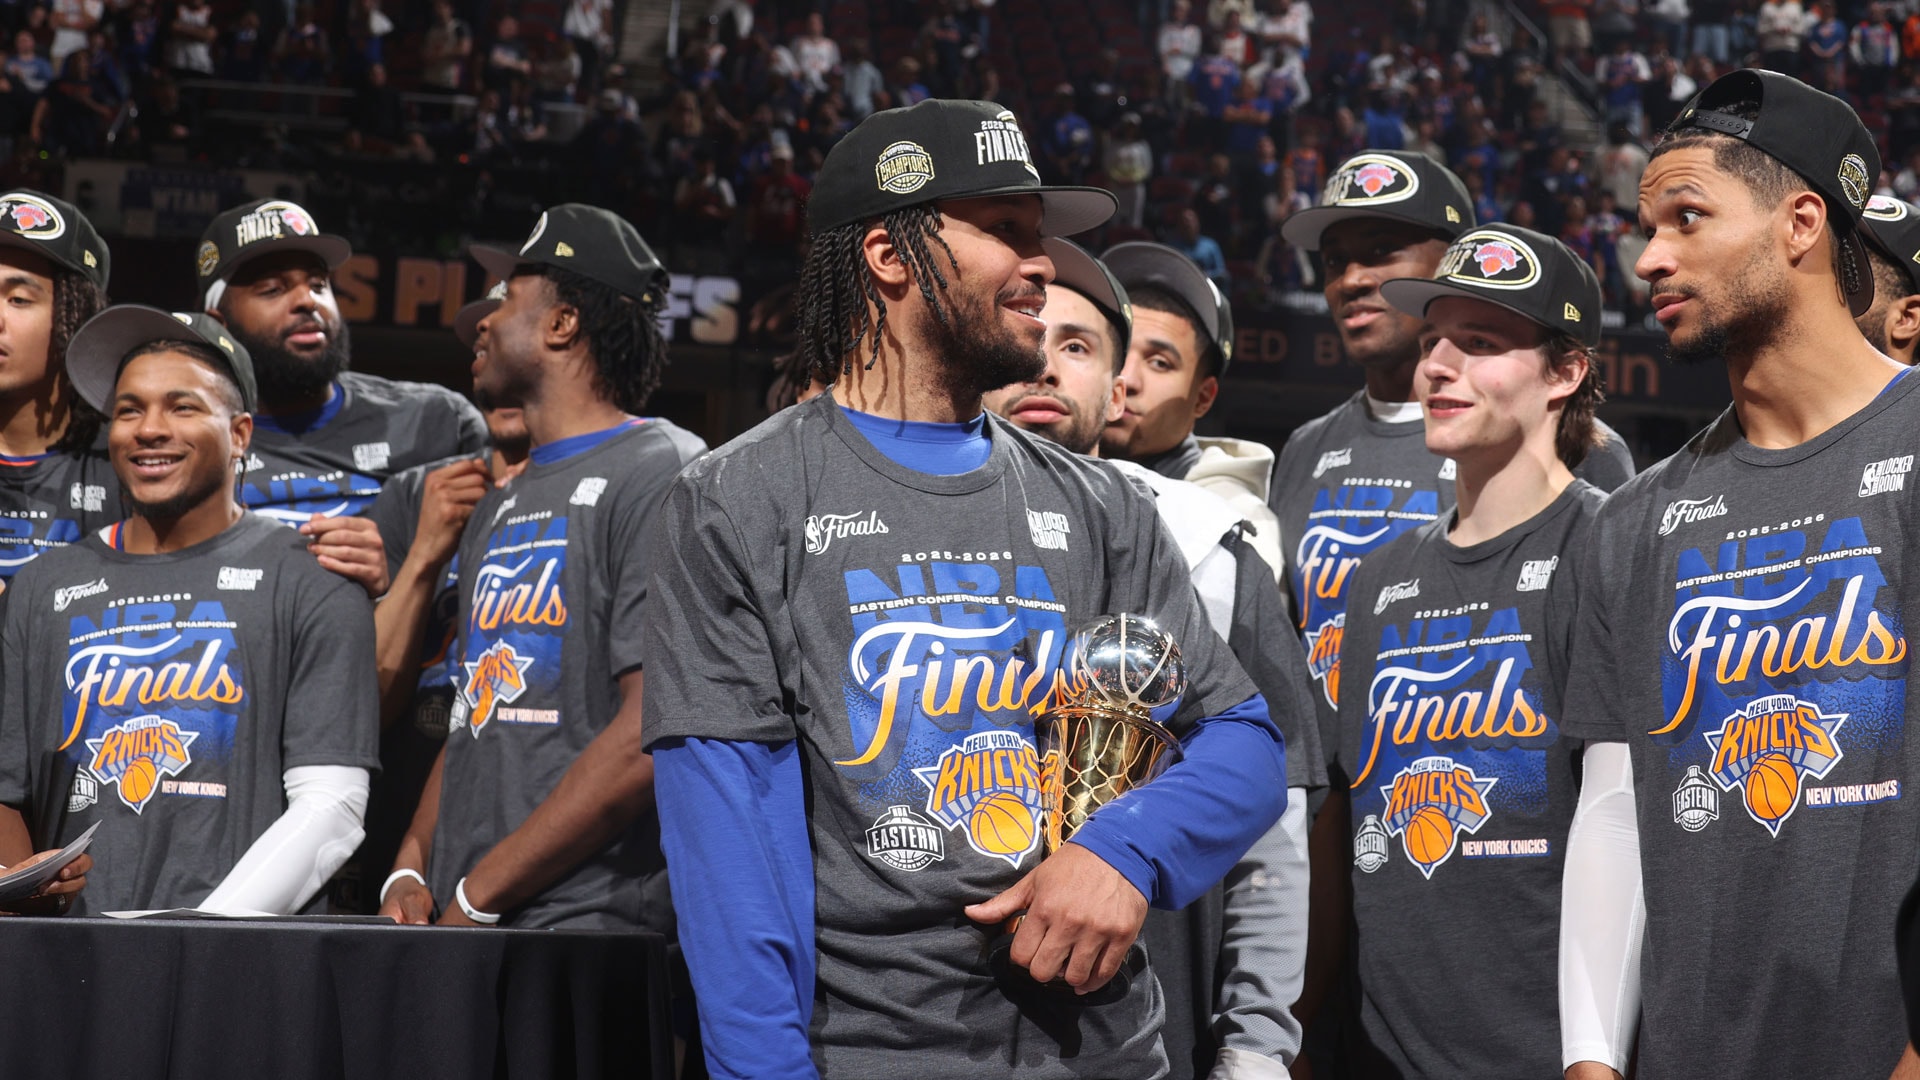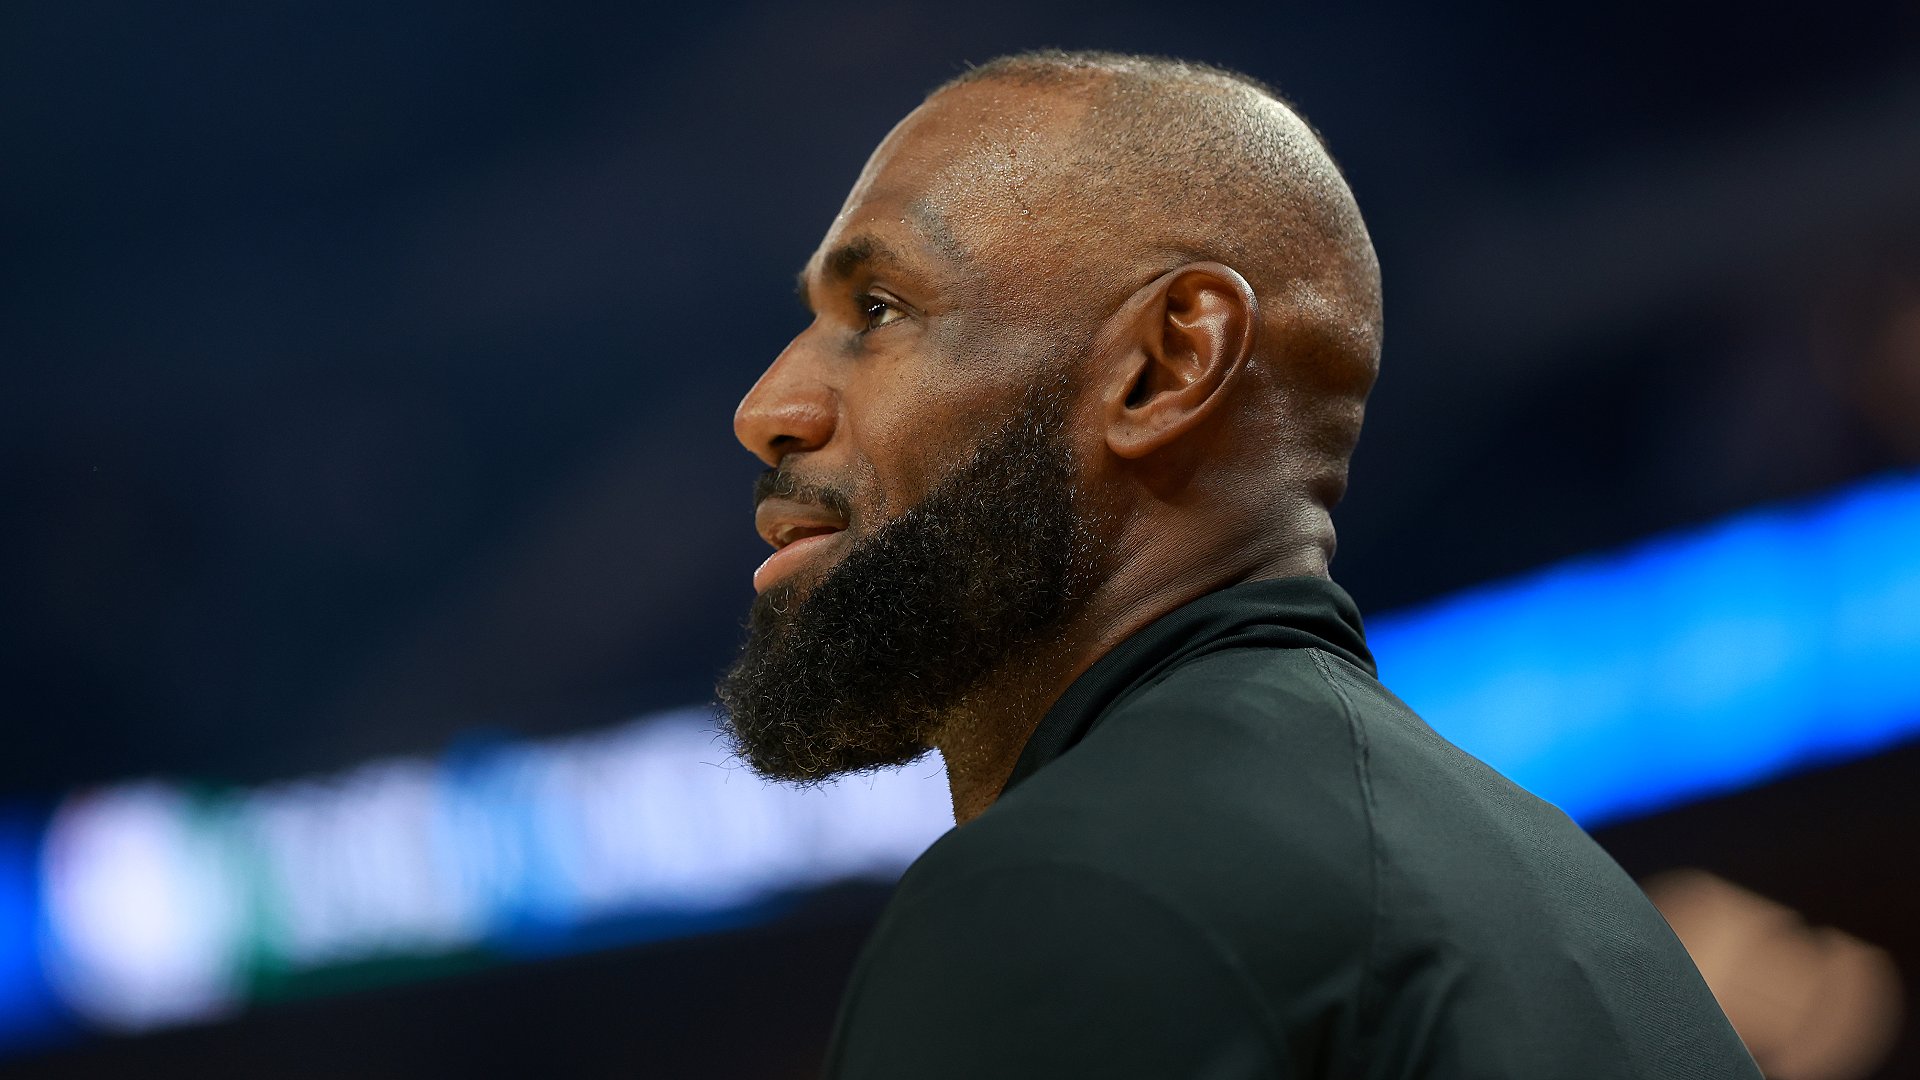
The Knicks are sure to be keyed in on slowing Victor Wembanyama in the NBA Finals.
The New York Knicks have been the most dominant playoff team in NBA history. The San Antonio Spurs have had the tougher path to get here.
Are the Knicks due for some statistical regression? Do the Spurs have enough left in the tank after a seven-game grind against the defending champs? We’re about to find out.
Here are 25 numbers to know about both teams and their paths to the Finals, which tip off Wednesday night (8:30 ET, ABC).
The basics
1. The Knicks have outscored their opponents by 19.4 points per game, which would be the best point differential in NBA playoff history. They’ve had both the No. 1 offense and the No. 1 defense in these playoffs, in terms of total points scored and allowed per 100 possessions, and in how they’ve performed relative to their opponents’ regular-season numbers (see below).
2. The Knicks have outscored their opponents by 27.6 points per 100 possessions in the first quarter, the best playoff mark in any quarter for a team that won at least one series in the last eight years. The Spurs’ plus-26.0 in the third quarter is the second best.
3. The Knicks have been the best rebounding team in the playoffs by a wide margin, grabbing 54.8% of available rebounds. They rank third in both offensive and defensive rebounding percentage.
4. The Spurs’ six wins by at least 20 points are tied for the most in NBA playoff history. The Knicks’ five wins by at least 25 points are also tied for the most in NBA playoff history.
5. The Spurs have outscored their opponents by 8.8 points per game in the restricted area, the best differential in the playoffs. The Knicks have the third-best (plus-7.7 per game).
Spurs’ efficiency by round
| Round | Opponent | OffRtg | Rank | DefRtg | Rank | AdjO | Rank | AdjD | Rank |
|---|---|---|---|---|---|---|---|---|---|
| First round | Portland | 116.6 | 7 | 102.2 | 4 | +3.1 | 9 | -10.9 | 7 |
| Conf. semis | Minnesota | 117.9 | 6 | 102.1 | 3 | +5.4 | 7 | -13.5 | 2 |
| Conf. finals | Oklahoma City | 112.4 | 13 | 107.9 | 10 | +5.9 | 5 | -9.7 | 9 |
| TOTAL | 115.4 | 3 | 104.4 | 2 | +5.0 | 3 | -11.3 | 2 |
OffRtg = Points scored per 100 possessions | AdjO = OffRtg – opponent’s regular-season DefRtg | DefRtg = Points allowed per 100 possessions | AdjD = DefRtg – opponent’s regular-season OffRtg | Rank = Among every team’s numbers in each series (of 28) | Rank in totals row = Among the 16 teams
That means the Spurs had the ninth-best, seventh-best and fifth-best series of these playoffs offensively, scoring 3.1, 5.4 and 5.9 more points per 100 possessions than the Blazers, Wolves and Thunder allowed in the regular season, respectively.
Overall, San Antonio has scored 5 more and allowed 11.3 fewer points per 100 possessions than their opponents allowed/scored in the regular season (weighted for total possessions vs. each opponent).
Spurs’ offense
6. According to Synergy tracking, 22.4% of San Antonio’s possessions have been in transition. That’s the highest rate in the playoffs and up from 21.3% (fifth) in the regular season.
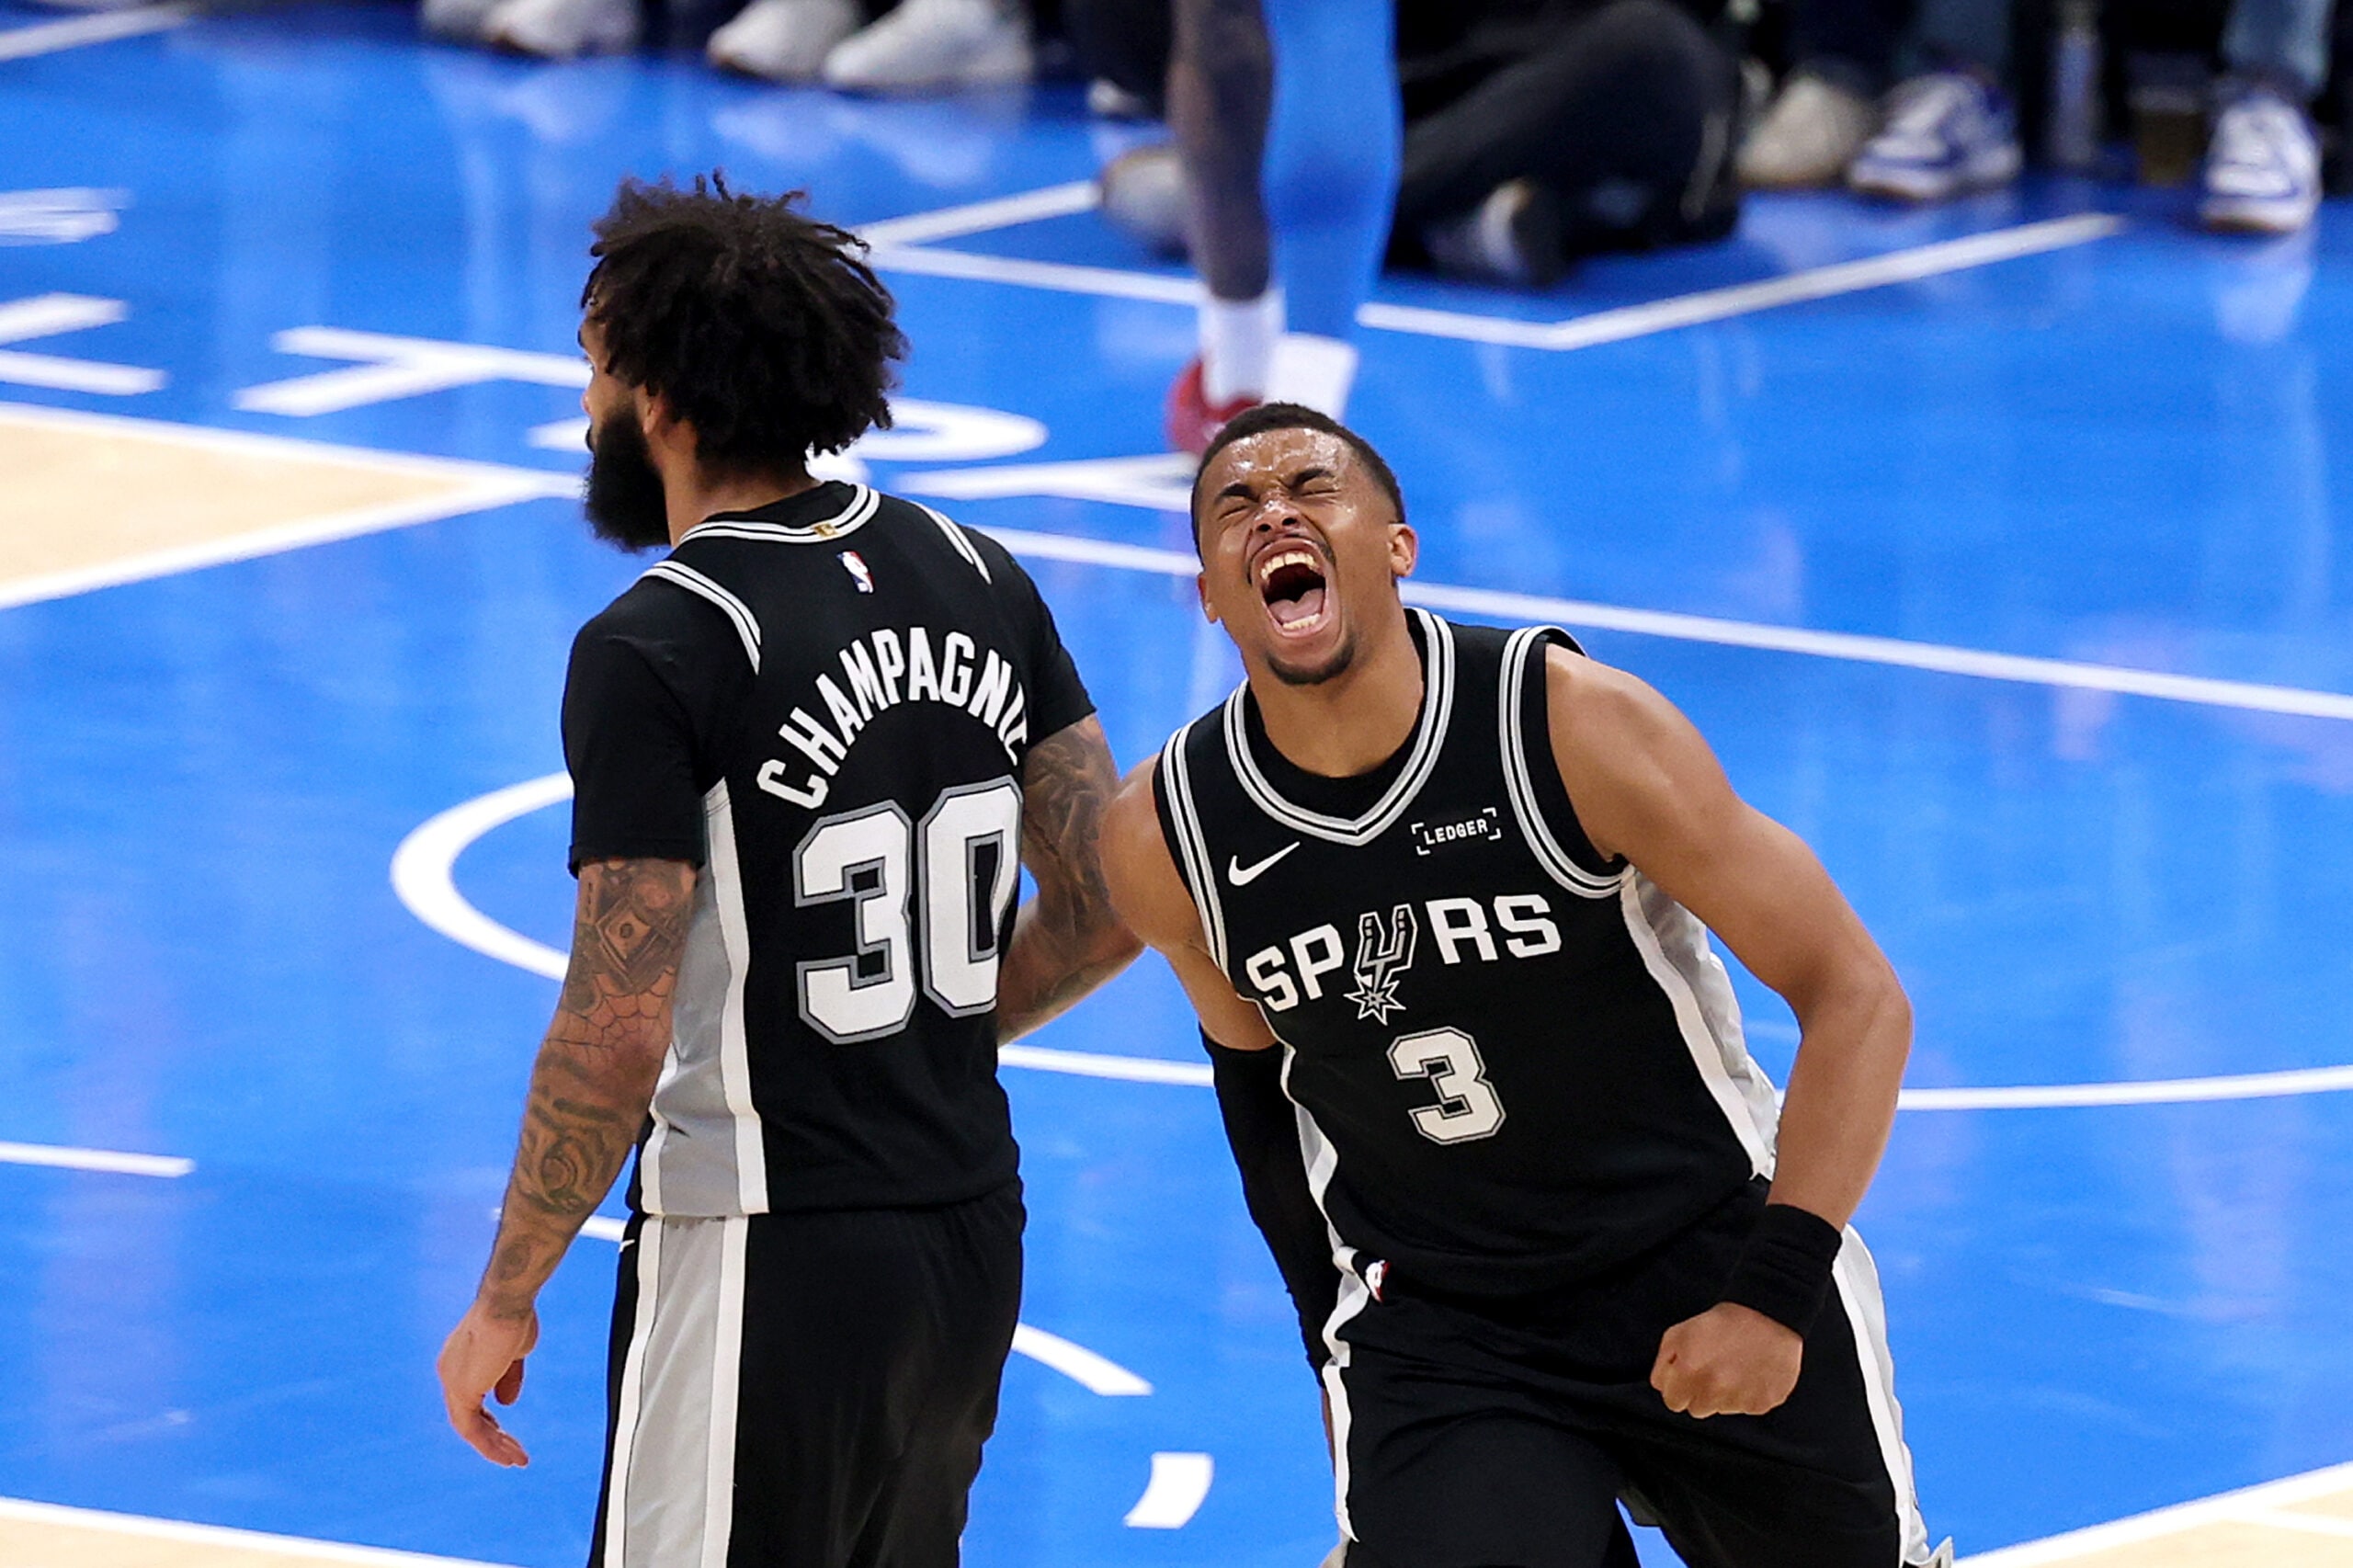
7. The Spurs have six players who have shot 36% or better on at least 25 3-point attempts. That’s two more than any other team, including the Knicks, who have four.
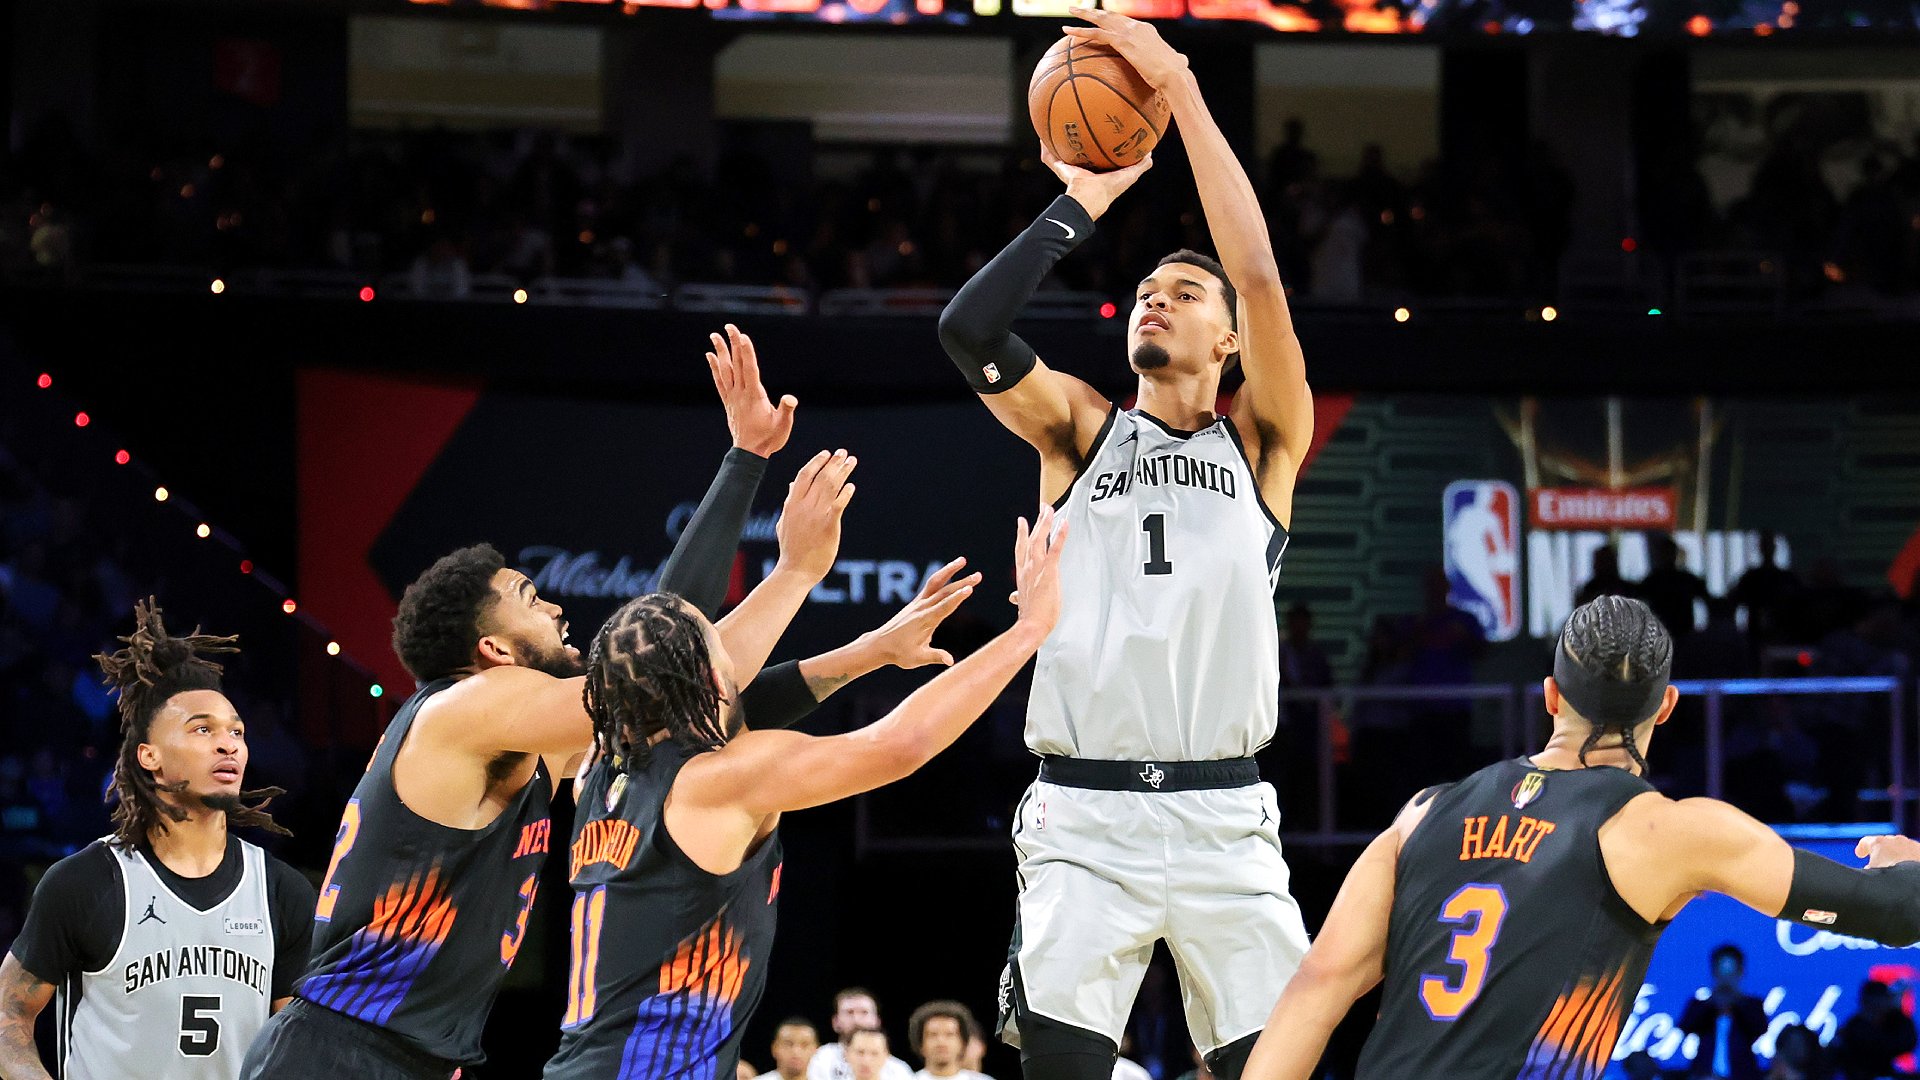
8. Victor Wembanyama has a true shooting percentage of 63.6%, the best mark among 22 players who’ve averaged at least 20 points per game in the playoffs.
9. Wembanyama has set 208 ball screens for Stephon Castle, the most for any combination in these playoffs. The Spurs have scored 1.21 points per chance when a Castle-Wembanyama pick-and-roll has led directly to a shot, turnover or trip to the line. That rate ranks second (behind Jalen Brunson-Mitchell Robinson, 1.23 per chance) among 22 combinations with at least 50 direct ball-screens. Castle’s 36 assists to Wembanyama are the most from any player to a single teammate in these playoffs.
Spurs’ defense
10. After scoring 126.3 points per 100 possessions through the first two rounds (their best eight-game stretch of offense all season), the Thunder scored just 107.9 per 100 in the conference finals.
11. The Spurs’ opponents’ effective field goal percentage (47.8%) and their opponents’ field goal percentage in the paint (48%) are both the lowest opponent marks for any team in the last seven postseasons (since the Milwaukee Bucks in 2019).
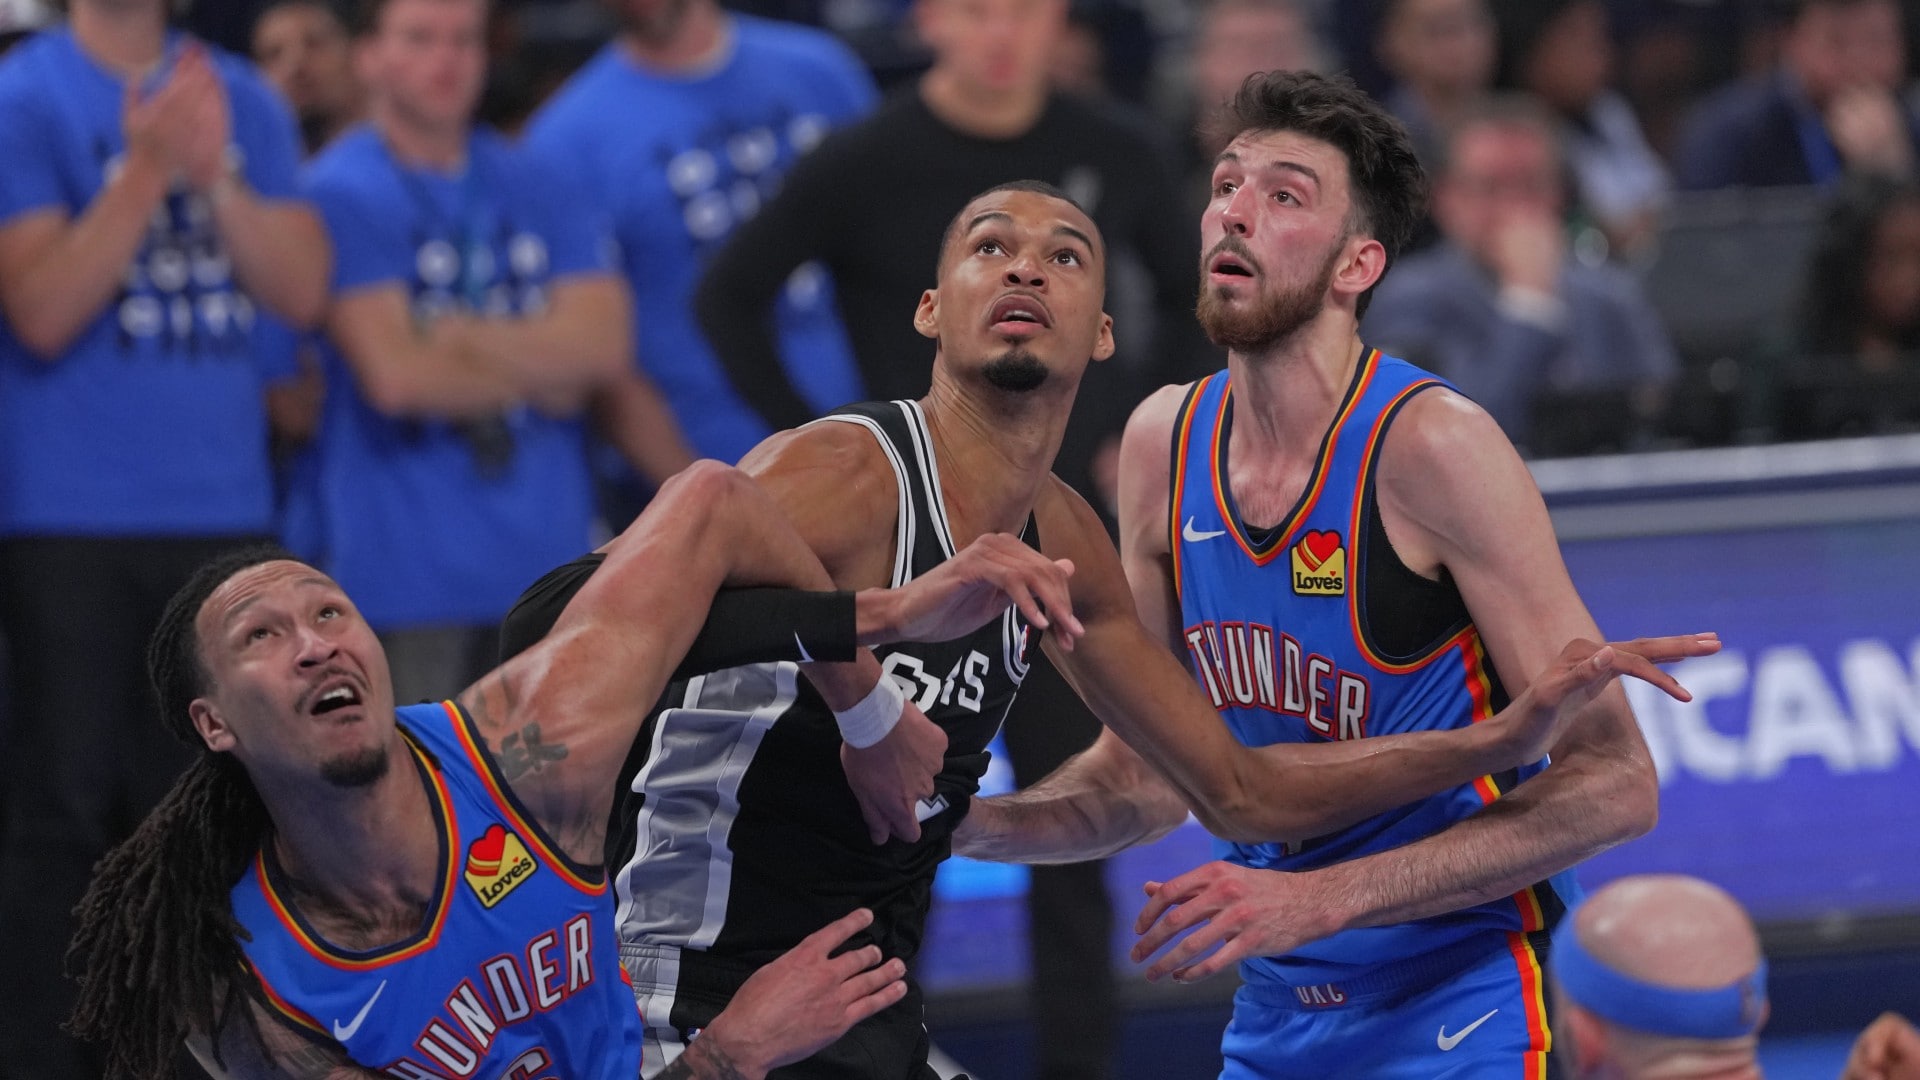
12. Opponents have shot just 44-for-98 (44.9%) and 45-for-99 (45.5%) at the rim when Wembanyama and Luke Kornet have been there to protect it, respectively. Those are the two best rim protection marks among 14 players who’ve defended at least 50 shots at the rim in the playoffs and would be the third and fifth best marks in the last 10 years. Wembanyama’s 60 total blocks are tied for the most for any player in a single postseason in the last 19 years (since Tim Duncan had 62 in 2007).
13. The Spurs have allowed 4.2 corner 3-pointers per game, the most in the playoffs. Their opponents have taken 32% of their 3-point attempts from the corners, also the highest opponent rate.
Knicks’ efficiency by round
| Round | Opponent | OffRtg | Rank | DefRtg | Rank | AdjO | Rank | AdjD | Rank |
|---|---|---|---|---|---|---|---|---|---|
| First round | Atlanta | 121.9 | 4 | 103.8 | 5 | +9.0 | 4 | -11.2 | 6 |
| Conf. semis | Philadelphia | 129.1 | 1 | 106.3 | 7 | +14.7 | 1 | -8.0 | 11 |
| Conf. finals | Cleveland | 119.6 | 5 | 100.3 | 1 | +5.5 | 6 | -18.0 | 1 |
| TOTAL | 123.3 | 1 | 103.5 | 1 | +9.6 | 1 | -12.3 | 1 |
Knicks’ offense
14. New York has an effective field goal percentage of 59.2%, which would be the highest mark in NBA playoff history. Among 95 players with at least 50 field-goal attempts in the playoffs, OG Anunoby (from 58.1% to 67.9%), Karl-Anthony Towns (from 55.6% to 65.2%) and Mikal Bridges (from 57.1% to 63.8%) have seen the third, fourth and eighth biggest jumps, respectively, from the regular season.
15. They’ve averaged 16 seconds per possession, the longest rate in the playoffs. Brunson leads the playoffs in time of possession, though his 8.8 minutes of possession is the lowest playoff mark of his four years with the Knicks.
16. The Knicks lead the playoffs with 54.8 points in the paint per 100 possessions. Their 61.8% shooting in the paint would be the third-best mark for a team with at least 200 paint attempts in the 30 postseasons for which we have shot-location data (343 total teams).
17. Landry Shamet has shot 21-for-35 (60%) from 3-point range, the best mark among 84 players with at least 25 attempts. Towns (49%) and Anunoby (48%) have the fifth and seventh-best marks, respectively.
18. Robinson has averaged 18.3% of available offensive rebounds while he’s been on the floor. That’s the highest mark (by a healthy margin) among 146 players who’ve averaged at least 10 minutes per game in the playoffs.
Knicks’ defense
19. New York’s opponents have shot just 30.5% from 3-point range, which would be the lowest opponent playoff mark with a minimum of 500 attempts (40 total teams). That includes just 32.3% on wide-open 3s, the lowest opponent playoff mark (minimum 200 attempts) in the 13 years of tracking data (51 teams).
20. According to tracking data, the Knicks have blitzed 12.3% of ball-screens, the highest rate in the playoffs by a wide margin and up from 3.9% (16th highest) in the regular season. Brunson (18.6%), Robinson (15.5%) and Towns (14.3%) have the three highest blitz rates among 38 players who’ve been the screener’s defender on at least 75 ball-screens in the playoffs.
21. The Knicks have allowed just 0.83 points per chance when Towns has been the screener’s defender on a ball-screen, down from 0.98 per chance in the regular season.
Who’s on the floor?
22. The Knicks have scored 126.3 points per 100 possessions with Brunson on the floor. That’s the highest on-court mark on offense among 146 players who’ve averaged at least 10 minutes per game.
23. The Knicks have had the No. 1 bench in the playoffs by a healthy margin, and they’ve outscored their opponents by 26.1 points per 100 possessions with Miles McBride on the floor. That’s the best on-court mark among 146 players who’ve averaged at least 10 minutes per game in the playoffs.
24. The Spurs have gotten 624 minutes from rookies (Dylan Harper and Carter Bryant). That’s the most through three rounds for a team that reached the Finals in the last 33 years (since the 1993 Phoenix Suns).
25. Spurs opponents have taken 43% of their shots in the paint with Wembanyama on the floor and 54% of their shots in the paint with Wembanyama off the floor.
* * *
John Schuhmann has covered the NBA for more than 20 years. You can e-mail him here, find his archive here and follow him on Bluesky.