The Spurs and Heat have been two of the teams making waves, stats-wise, early in 2025-26.
The 2025-26 season is still very young, with nine teams still having played just four games. Four teams remain undefeated, while three are still looking for their first win.
Things can change quickly (five eventual playoff teams had losing records at this point last year), but here are 10 numbers to know from the first 10 days of the season…
All stats are through Thursday, Oct. 30.
1. The league has scored 117.7 points (per team) per game.
That would be the third-highest mark in NBA history and the highest in the last 64 seasons (since 1961-62). It’s a product of both pace and efficiency.
The 101.9 possessions (per team) per 48 minutes that the league has averaged would be the highest rate in the 30 years of play-by-play data. That could certainly go down, as pace often slows as the season goes on.
But efficiency almost always goes up, and the league’s 114.3 points scored per 100 possessions is already close to the highest mark in league history: 114.5 per 100 two seasons ago. At this point that season, the league had averaged just 110.3 per 100.
Efficiency and pace, last four seasons
| Through 10 days | Full season | Diff. | ||||
|---|---|---|---|---|---|---|
| Season | OffRtg | Pace | OffRtg | Pace | OffRtg | Pace |
| 2022-23 | 111.6 | 100.6 | 114.1 | 99.8 | +2.5 | -0.8 |
| 2023-24 | 110.3 | 101.1 | 114.5 | 99.2 | +4.3 | -1.9 |
| 2024-25 | 111.9 | 100.5 | 113.7 | 99.6 | +1.8 | -0.9 |
| 2025-26 | 114.3 | 101.9 | ||||
OffRtg = Points scored per 100 possessions
Pace = Possessions (per team) per 48 minutes
So it’s likely that the league is going to set a new record for efficiency for the sixth time in the last eight years.
2. The league has averaged 45.7 fouls per game and 29.8 free throw attempts per 100 shots from the field.
The most efficient way to score is at the free-throw line, and free throws are up. The 45.7 fouls per game is the most in the last 30 years and up 23% from the 37.2 per game the league averaged last season.
And it’s not just about the league’s points of emphasis regarding close-outs on jump shots. There have been fouls on 8.5% of drives, up from 7.2% last season and easily the highest rate in 13 years of tracking data.
The Orlando Magic (40.6 attempts per 100 shots from the field), the Houston Rockets (39.5 per 100) and the Los Angeles Lakers (38.3 per 100) would have the highest, second-highest and fifth-highest free-throw rates for any team in the last 20 seasons.
Free-throw rate generally goes down as the season goes on, but this is still much higher than the league’s free throw rate through 10 days the last few years…
Fouls and free-throw rate, last four seasons
| Through 10 days | Full season | Diff. | ||||
|---|---|---|---|---|---|---|
| Season | PF/G | FTA/FGA | PF/G | FTA/FGA | PF/G | FTA/FGA |
| 2022-23 | 43.0 | 0.268 | 40.0 | 0.266 | -3.0 | -0.001 |
| 2023-24 | 40.5 | 0.249 | 37.5 | 0.244 | -3.0 | -0.005 |
| 2024-25 | 42.7 | 0.281 | 37.2 | 0.243 | -5.5 | -0.038 |
| 2025-26 | 45.7 | 0.298 | ||||
3. Defenses have picked up the ball in the backcourt on 18.2% of possessions.
The additional fouls are also, in part, a result of more pressure defense. It’s a copycat league and teams are emulating the Indiana Pacers’ success in wearing teams down last season, picking up in the backcourt at the highest rate, by a wide margin, in 13 seasons of tracking data.
More pressure has also resulted in more turnovers. Efficiency is up despite the league averaging 15.3 turnovers per 100 possessions, up from 14.3 per 100 last season (14.9 per 100 through the first 10 days).
The Celtics, Suns and Cavs (in that order) have seen the league’s biggest jumps in their average pick-up point on defense, with 20 of the 30 teams having seen jumps from last season.
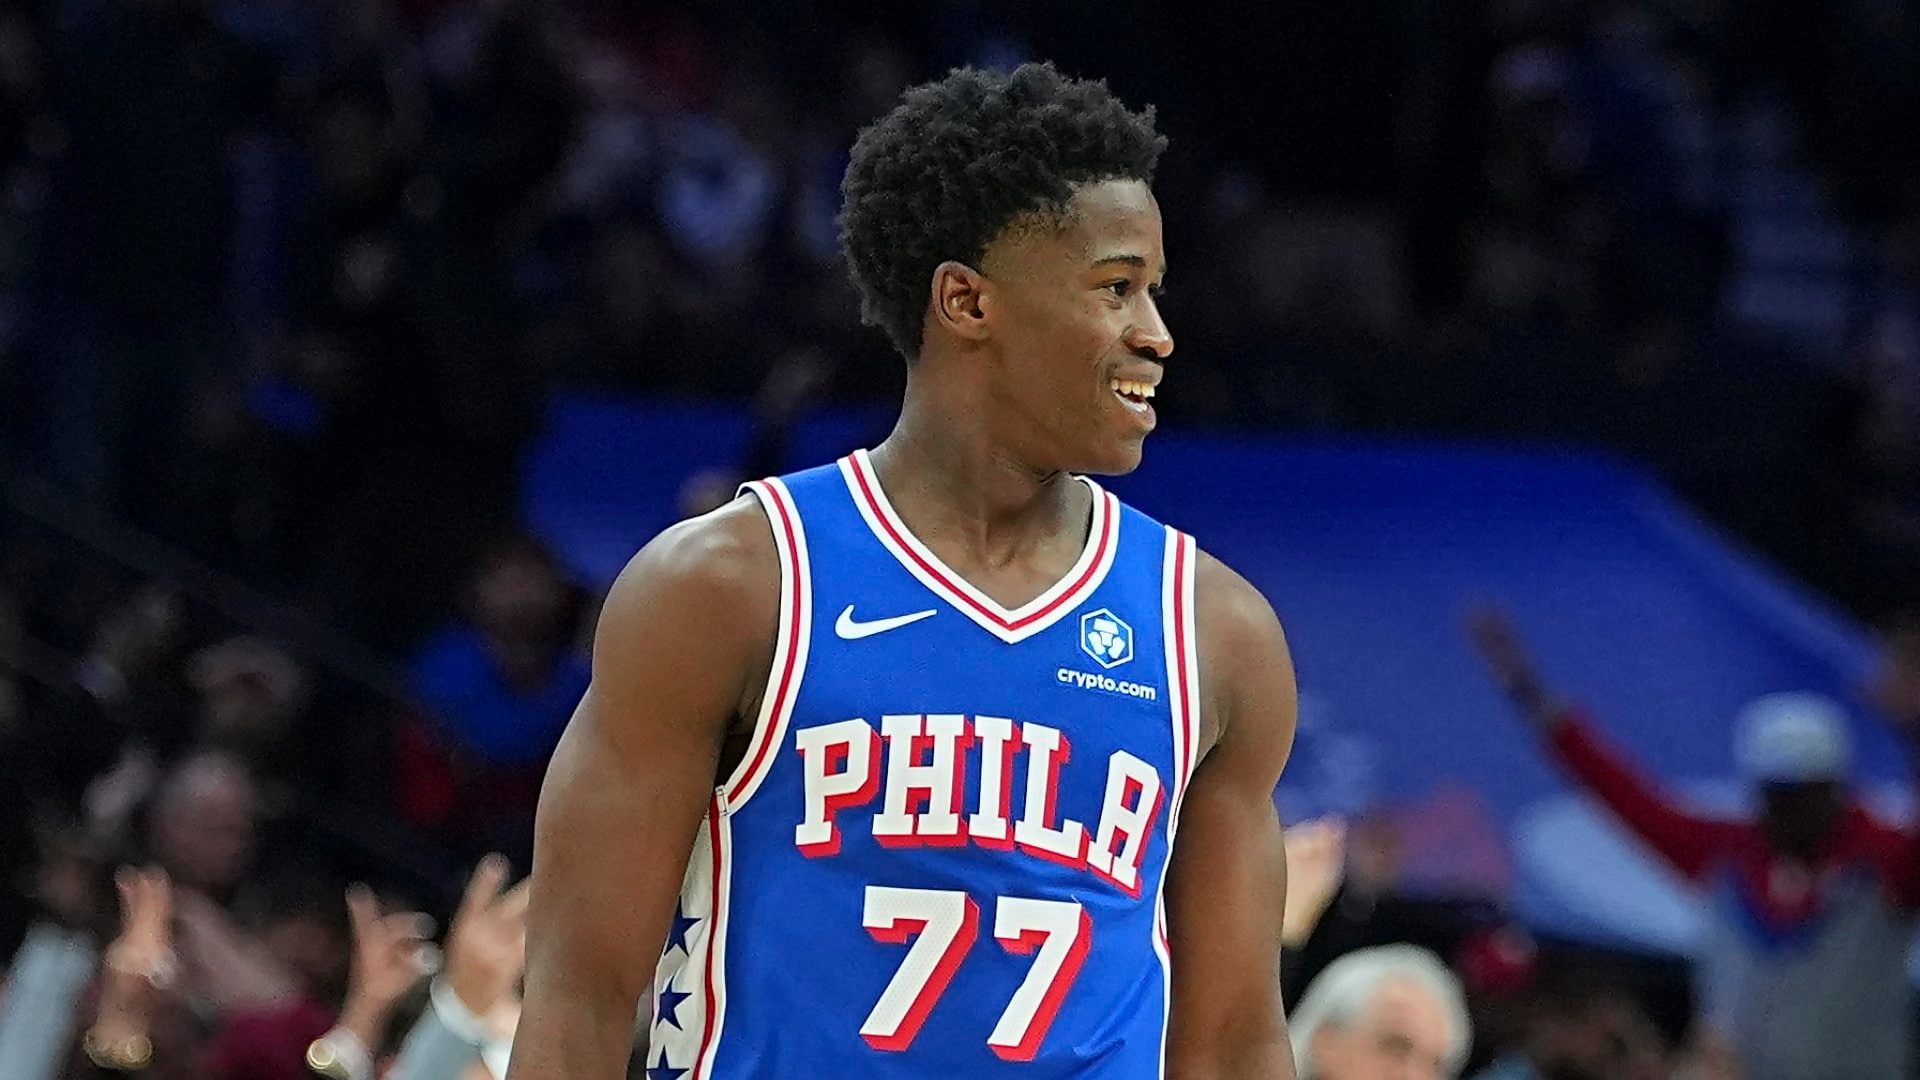
4. The Sixers rank last in shot quality, according to tracking data.
Tyrese Maxey has been on a scoring tear to open the 2025-26 season.
Yet the Sixers rank second in offensive efficiency, having scored 124.9 points per 100 possessions on their way to a perfect, 4-0 record.
They’re in the top 10 in each of the other four factors on offense: sixth in free-throw rate, second in turnover rate, and sixth in offensive rebounding percentage.
They’re also in the bottom 10 in field-goal percentage in the paint (54.8%). But the Sixers’ perimeter shooting (league-best 41.9% from 3-point range) is probably unsustainable.
Three of the Sixers’ four wins have also, amazingly, come after they trailed by double-digits in the fourth quarter. They were 0-46 when trailing by double-digits in the fourth quarter last season.
They’ll take their perfect record into their Emirates NBA Cup opener against the Celtics on Friday (7 p.m. ET, Prime Video).
5. The Heat have averaged just 12.6 seconds per offensive possession.
That would be the fastest average possession in the 13 seasons of tracking data by a healthy margin, with the previous fastest being the 13.1 seconds per possession that the Thunder averaged in 2018-19. (The Blazers — at 13 — are also under that mark this season.)
According to Synergy play-type tracking, 23.4% of the Heat’s possessions (the league’s second-highest rate) have been in transition. They’ve also set just 19.1 ball-screens per 100 possessions, a rate that’s about half the rate of any other team in the 13 seasons of tracking data. (The previous low, from the 2018-19 Sixers, was 37.9 per 100.)
Last season, only 16.5% of the Heat’s possessions (the league’s sixth-lowest rate) were in transition. They also averaged 69 ball-screens per 100 possessions (ninth most). They’ve made a major change to their offense and it’s worked thus far: they rank ninth offensively (after ranking in the bottom 10 in each of the last three seasons).
The Heat and their new offense began a four-game trip with a loss in San Antonio. Next up is a visit to the Lakers on Sunday (9:30 p.m. ET, NBA League Pass).
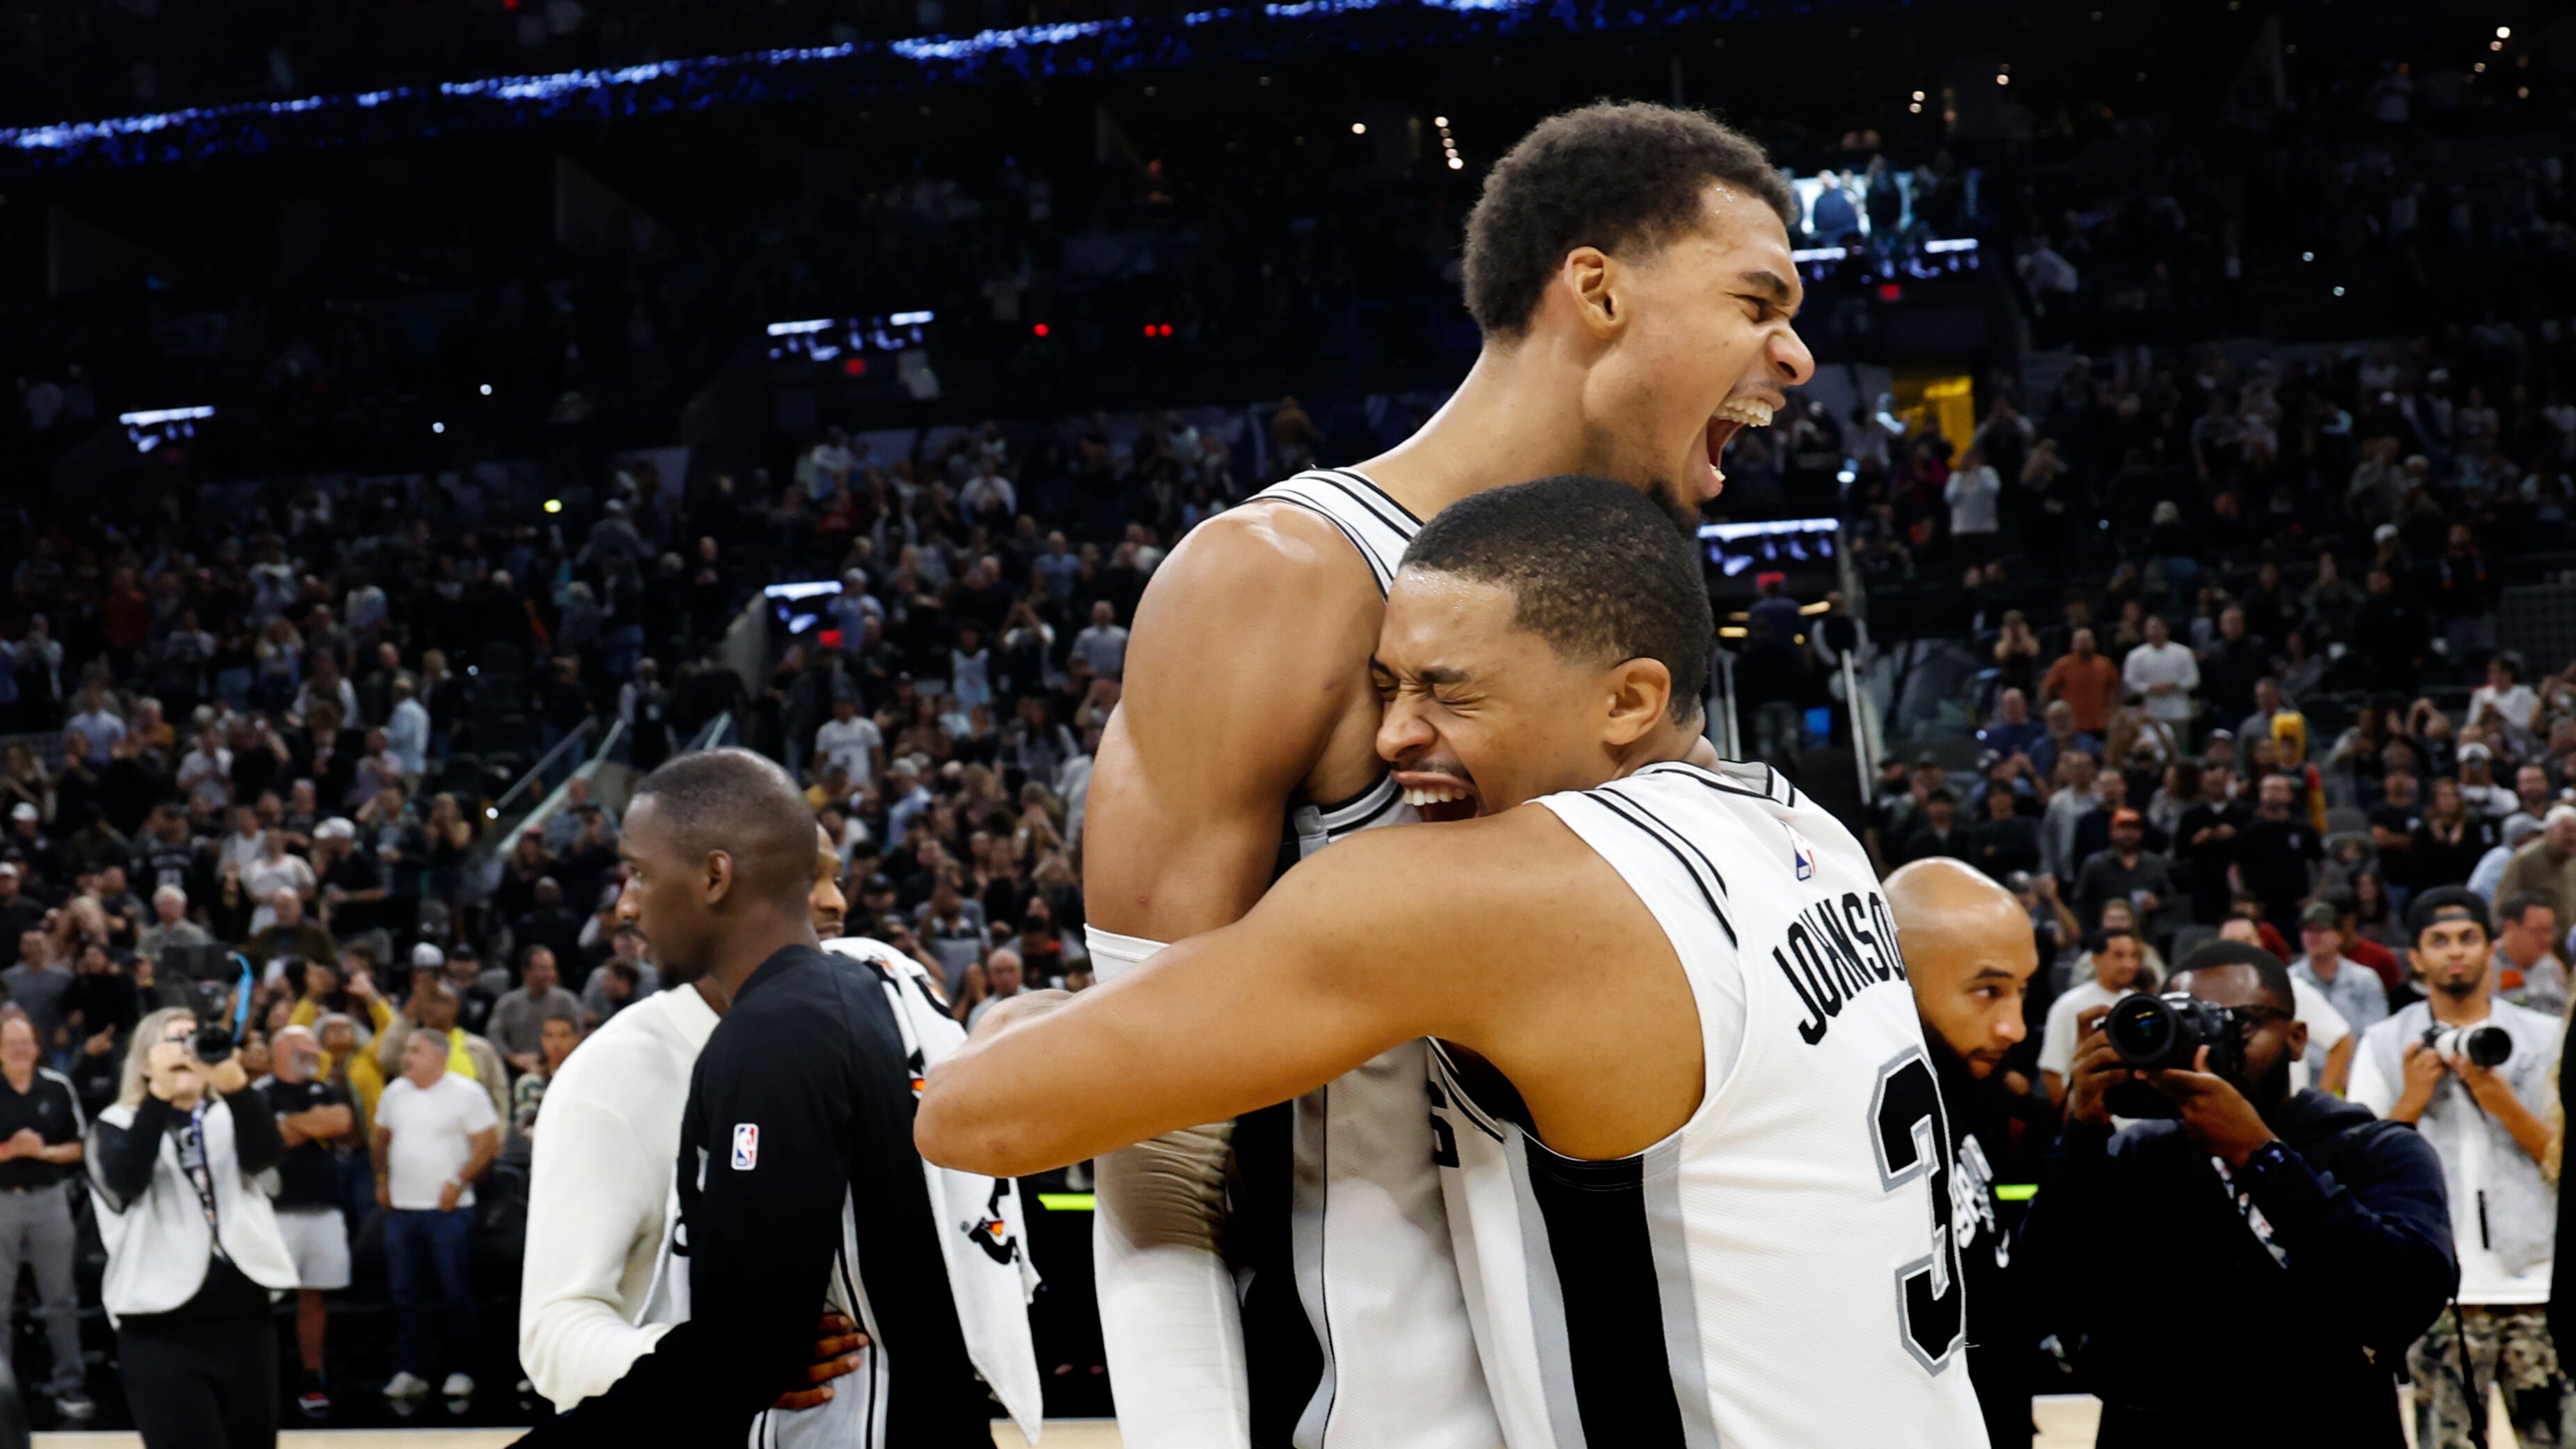
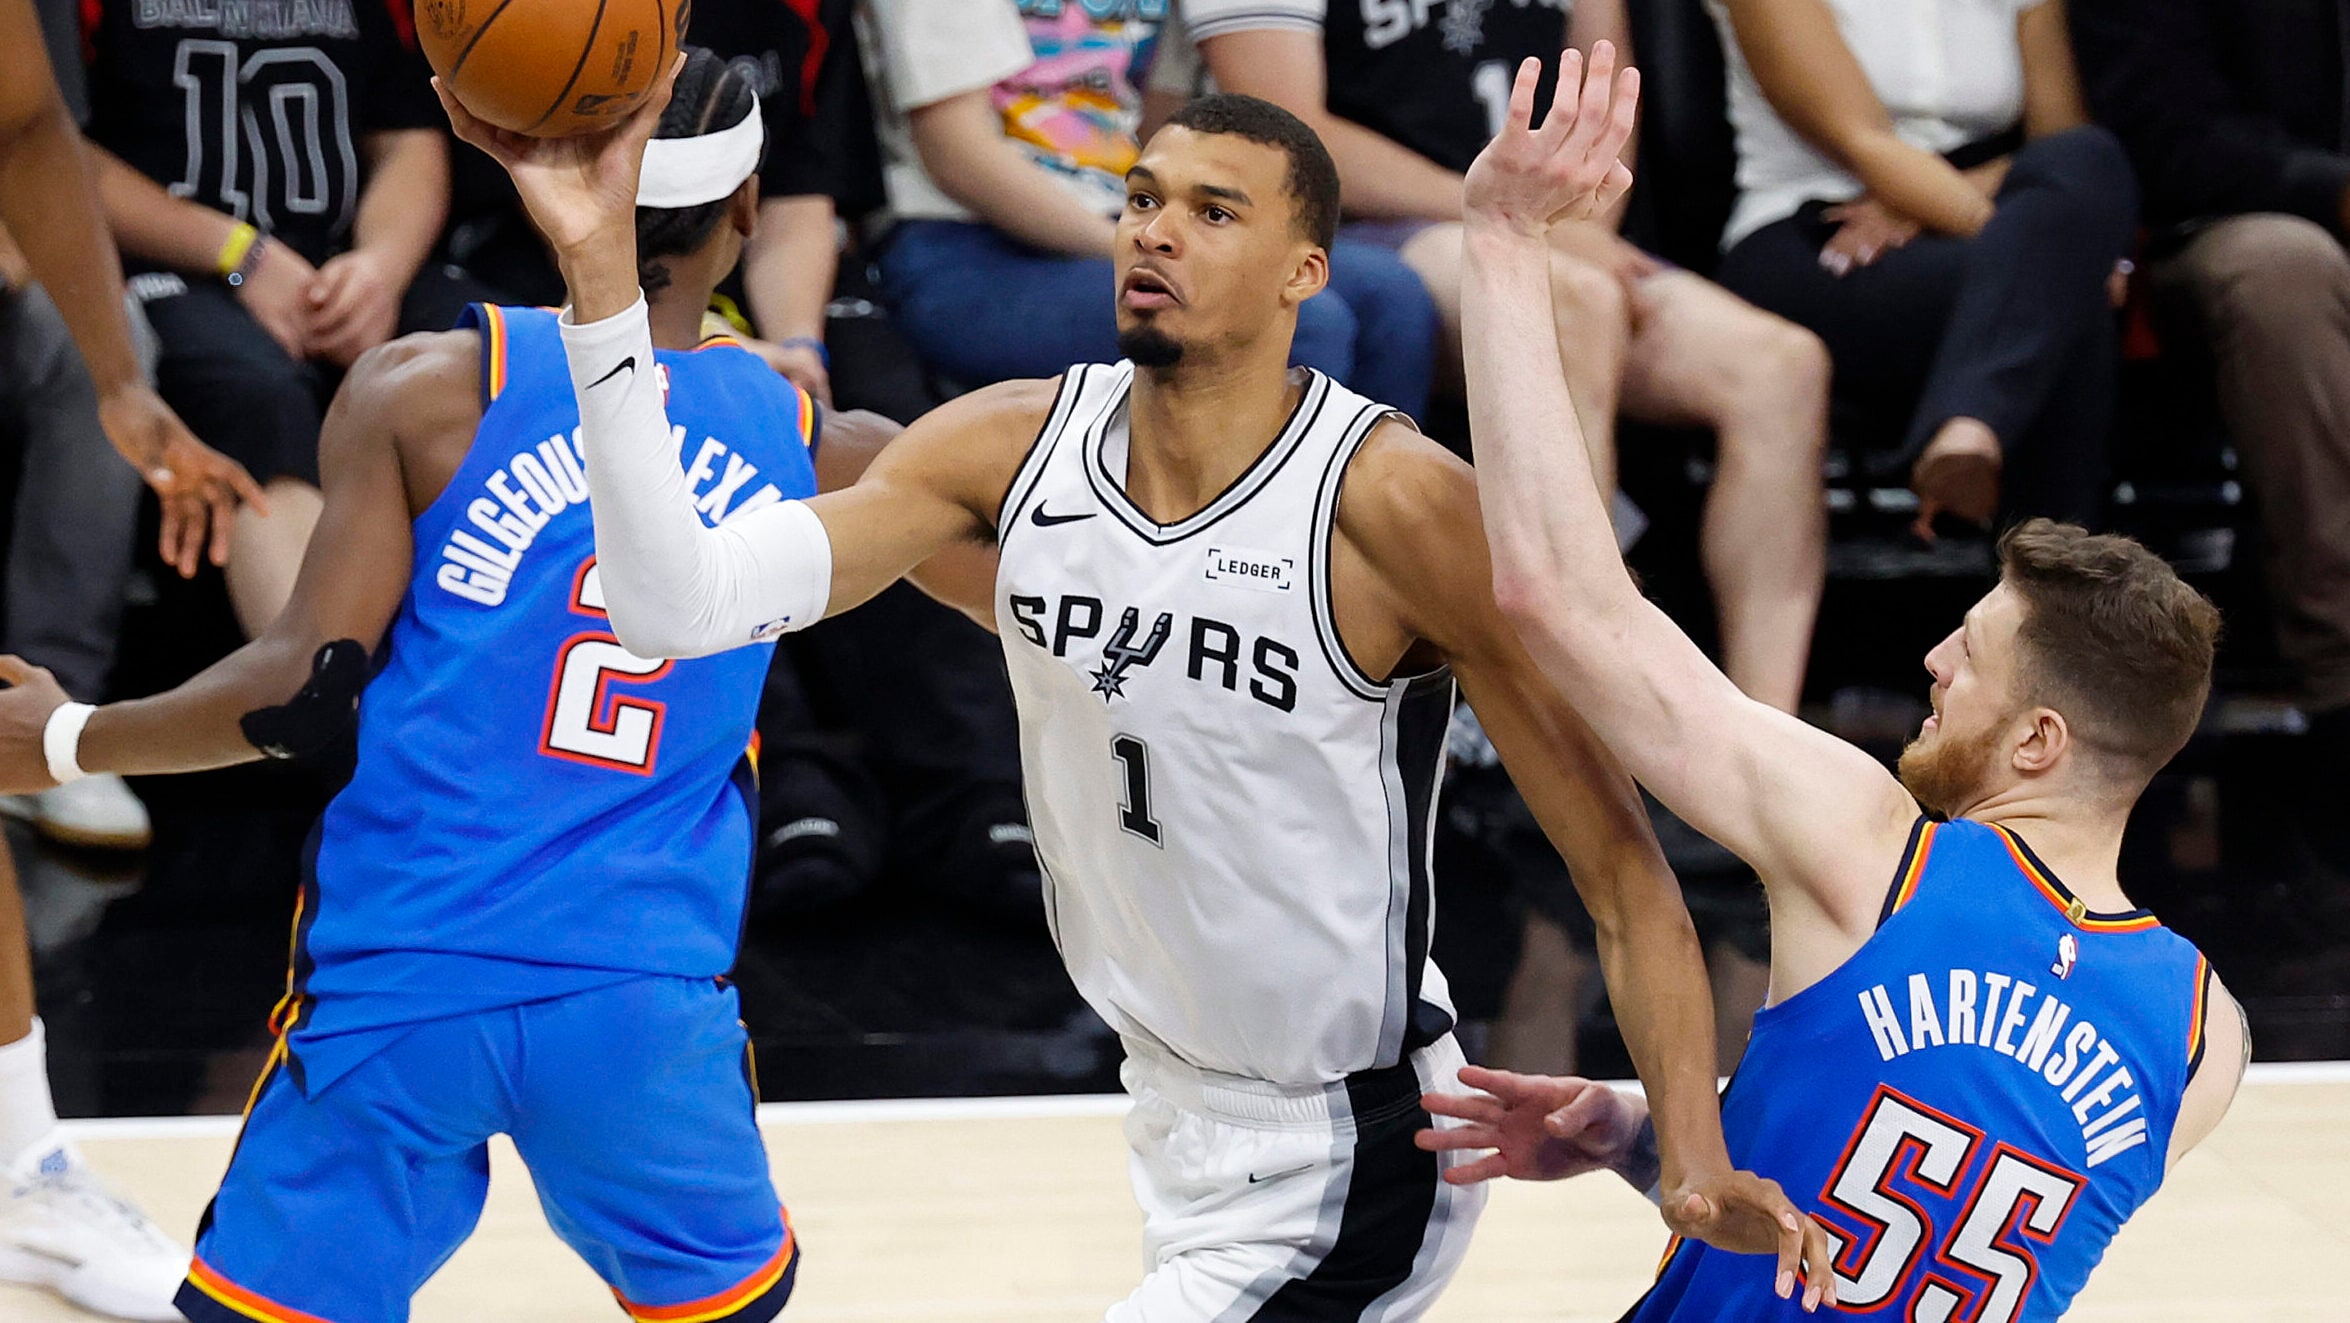
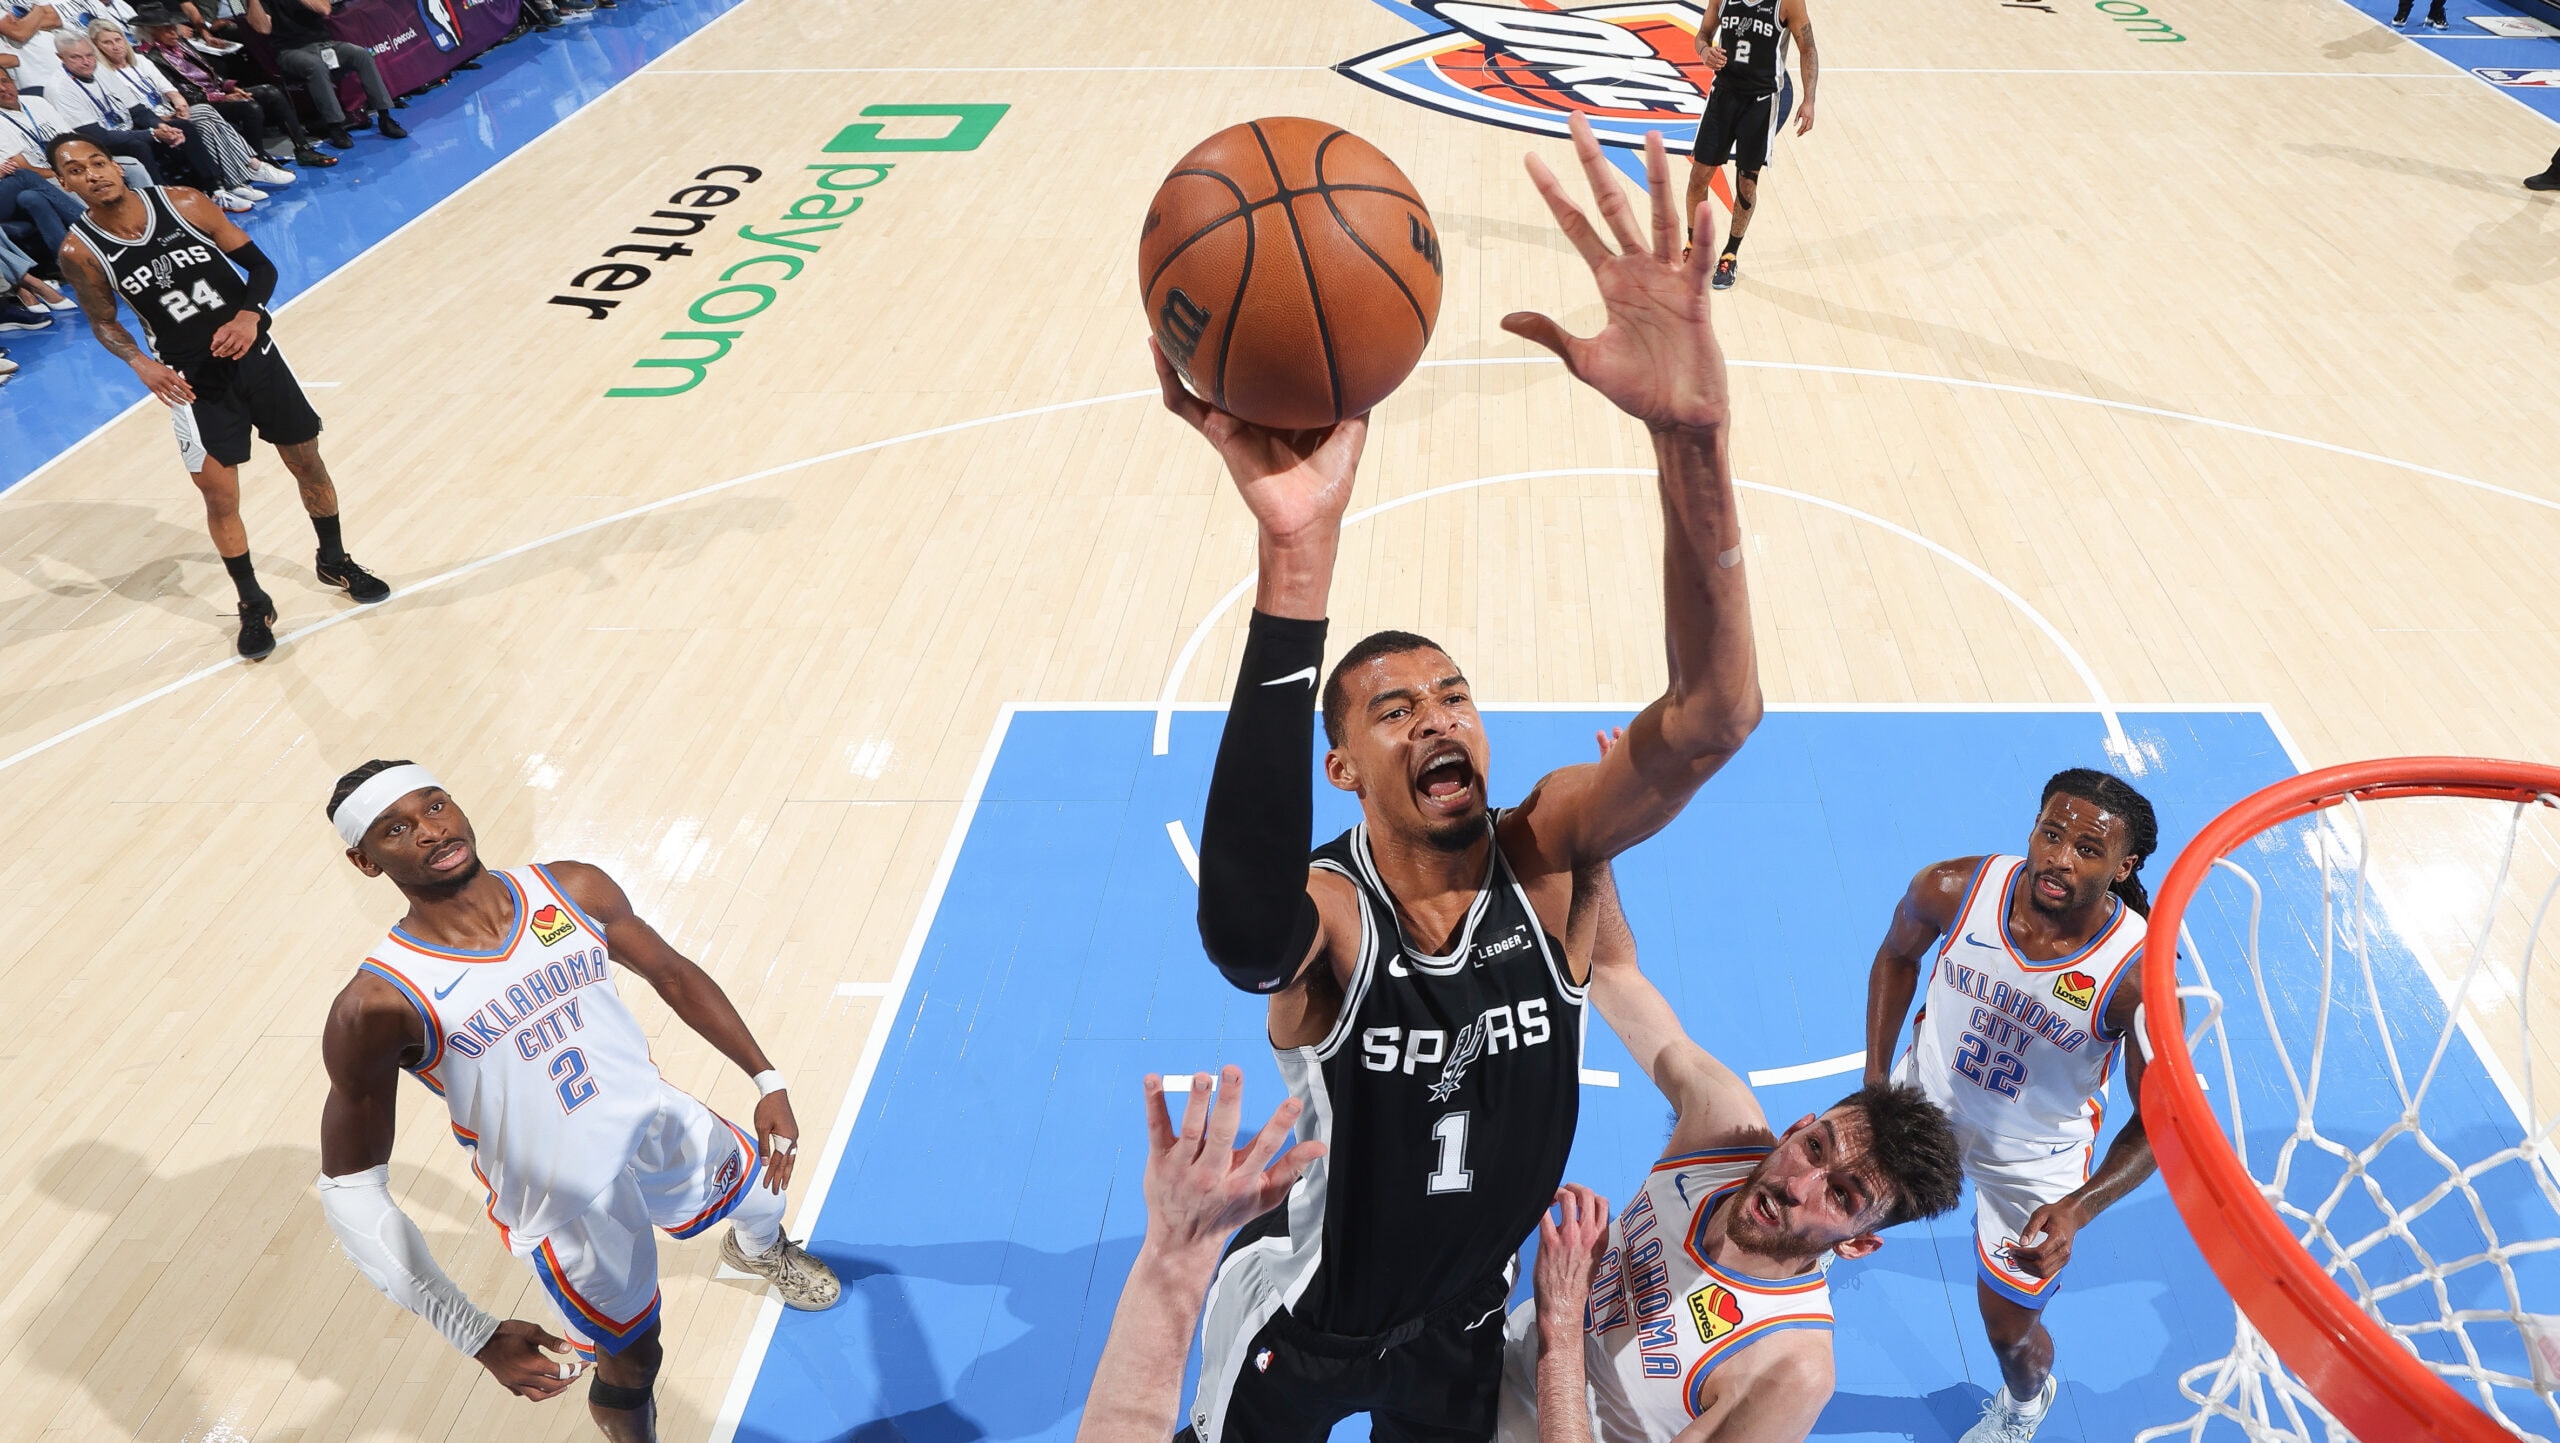
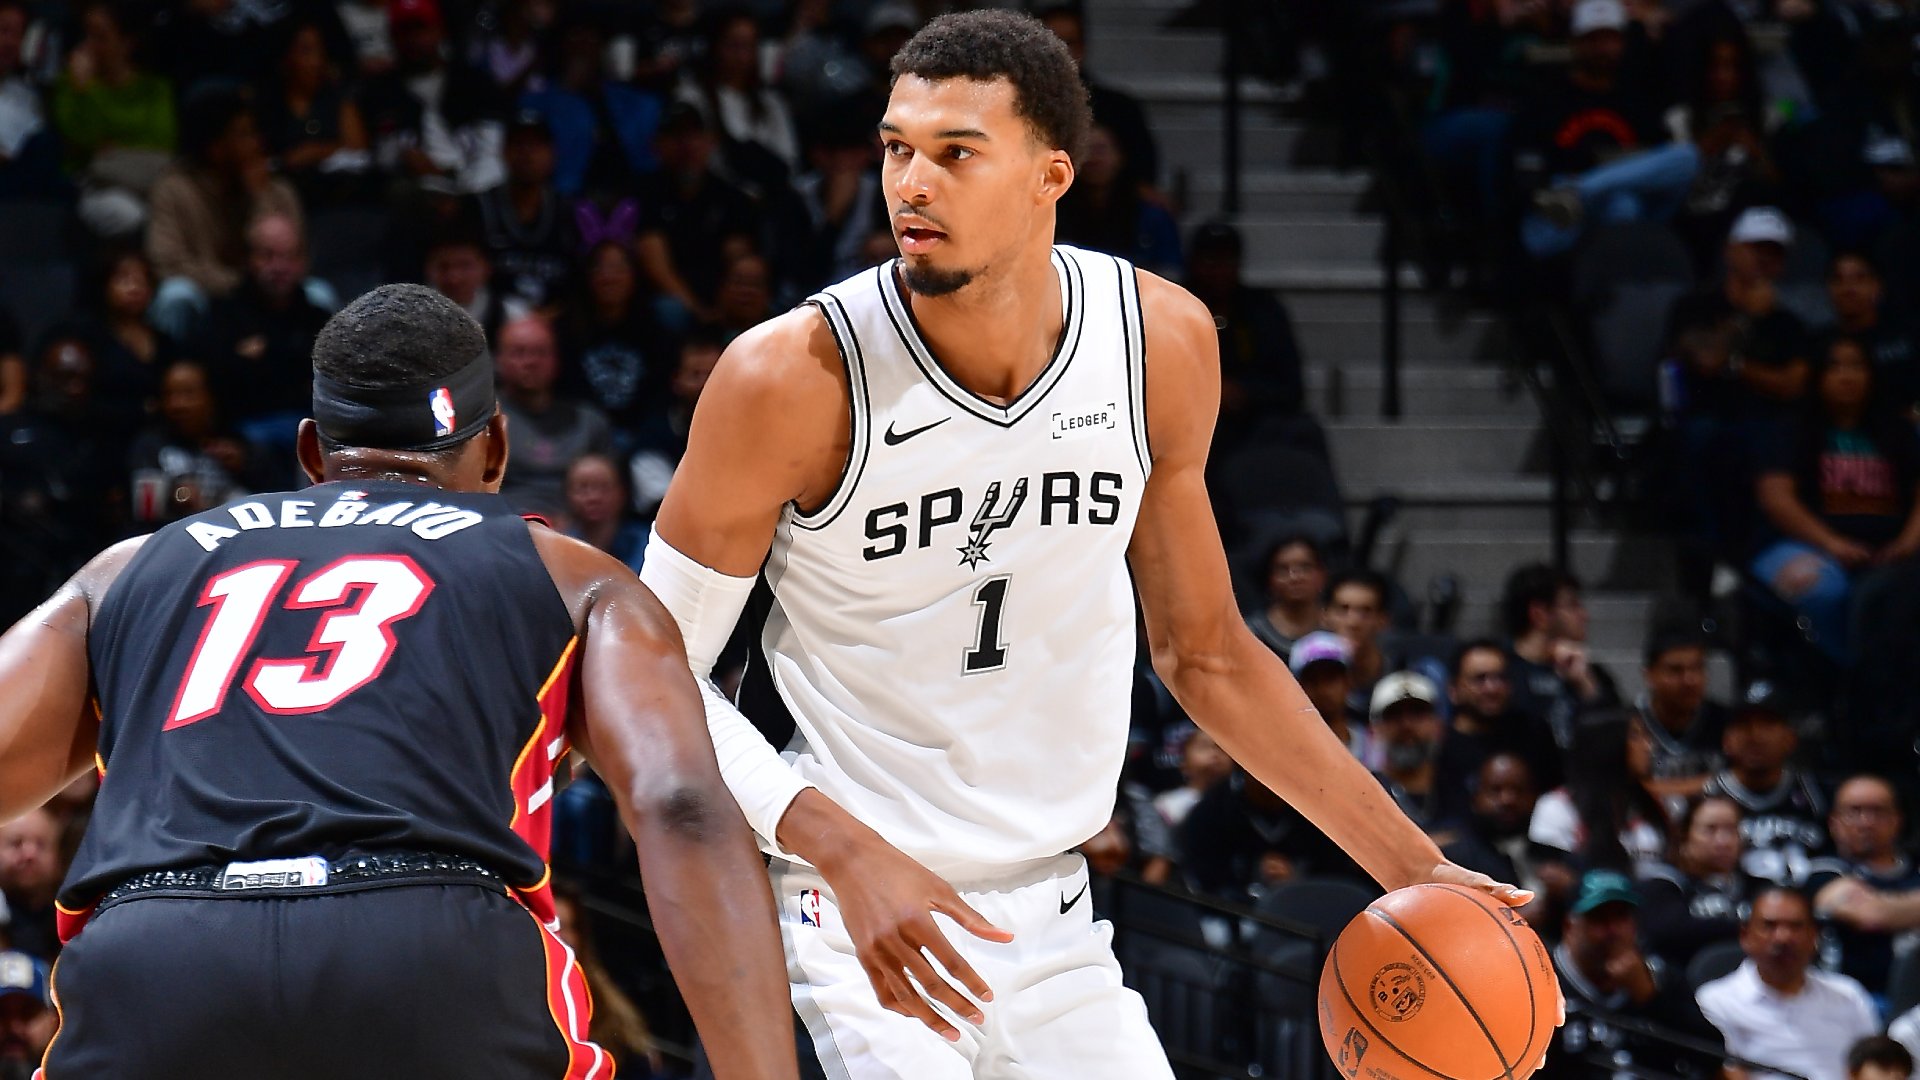
6. Victor Wembanyama has taken 61% of his shots in the paint.
It’s an oft-cited stat, but it’s critically important. Last season, the 7-foot-4 Wembanyama took just 37% of his shots in the paint, the same rate as 6-foot Pelicans guard Jose Alvarado. The Spurs’ star shot much more effectively in the paint (67%) than he did outside (50.1%).
This season, he’s playing much bigger, and the big jump in interior shots has come with a huge jump in free-throw rate. Wembanyama has averaged 50 free throw attempts per 100 shots from the field, up from 22.1 per 100 in 2024-25.
As a team, the Spurs have seen the league’s fourth-biggest drop in 3-point rate. But they’ve seen its fifth-biggest jump in effective field goal percentage, its third-biggest jump in free-throw rate, and its fourth-biggest jump in offensive rebounding percentage.
And they’re off to the first 5-0 start in franchise history. They’ll go for 6-0 when they visit the Suns on Sunday (8 p.m. ET, NBA League Pass).
7. Giannis Antetokounmpo has averaged 26.5 points in the paint per game.
Speaking of playing big … in the 30 seasons for which we have shot-location data, the record for points in the paint is 22.5 per game (Shaquille O’Neal, 1999-2000). Antetokounmpo already has the third-highest mark, a career-high 20.3 points in the paint per game two seasons ago.
* The 15 highest averages for points in the paint per game over the last 30 years are all held by O’Neal (eight), Antetokounmpo (five) or Zion Williamson (two).
This season, he’s playing bigger than ever to help the Bucks start 4-1, which includes a win Thursday vs. Golden State while Antetokounmpo rested. Next up is a visit from the Kings on Saturday (5 p.m. ET, NBA League Pass).
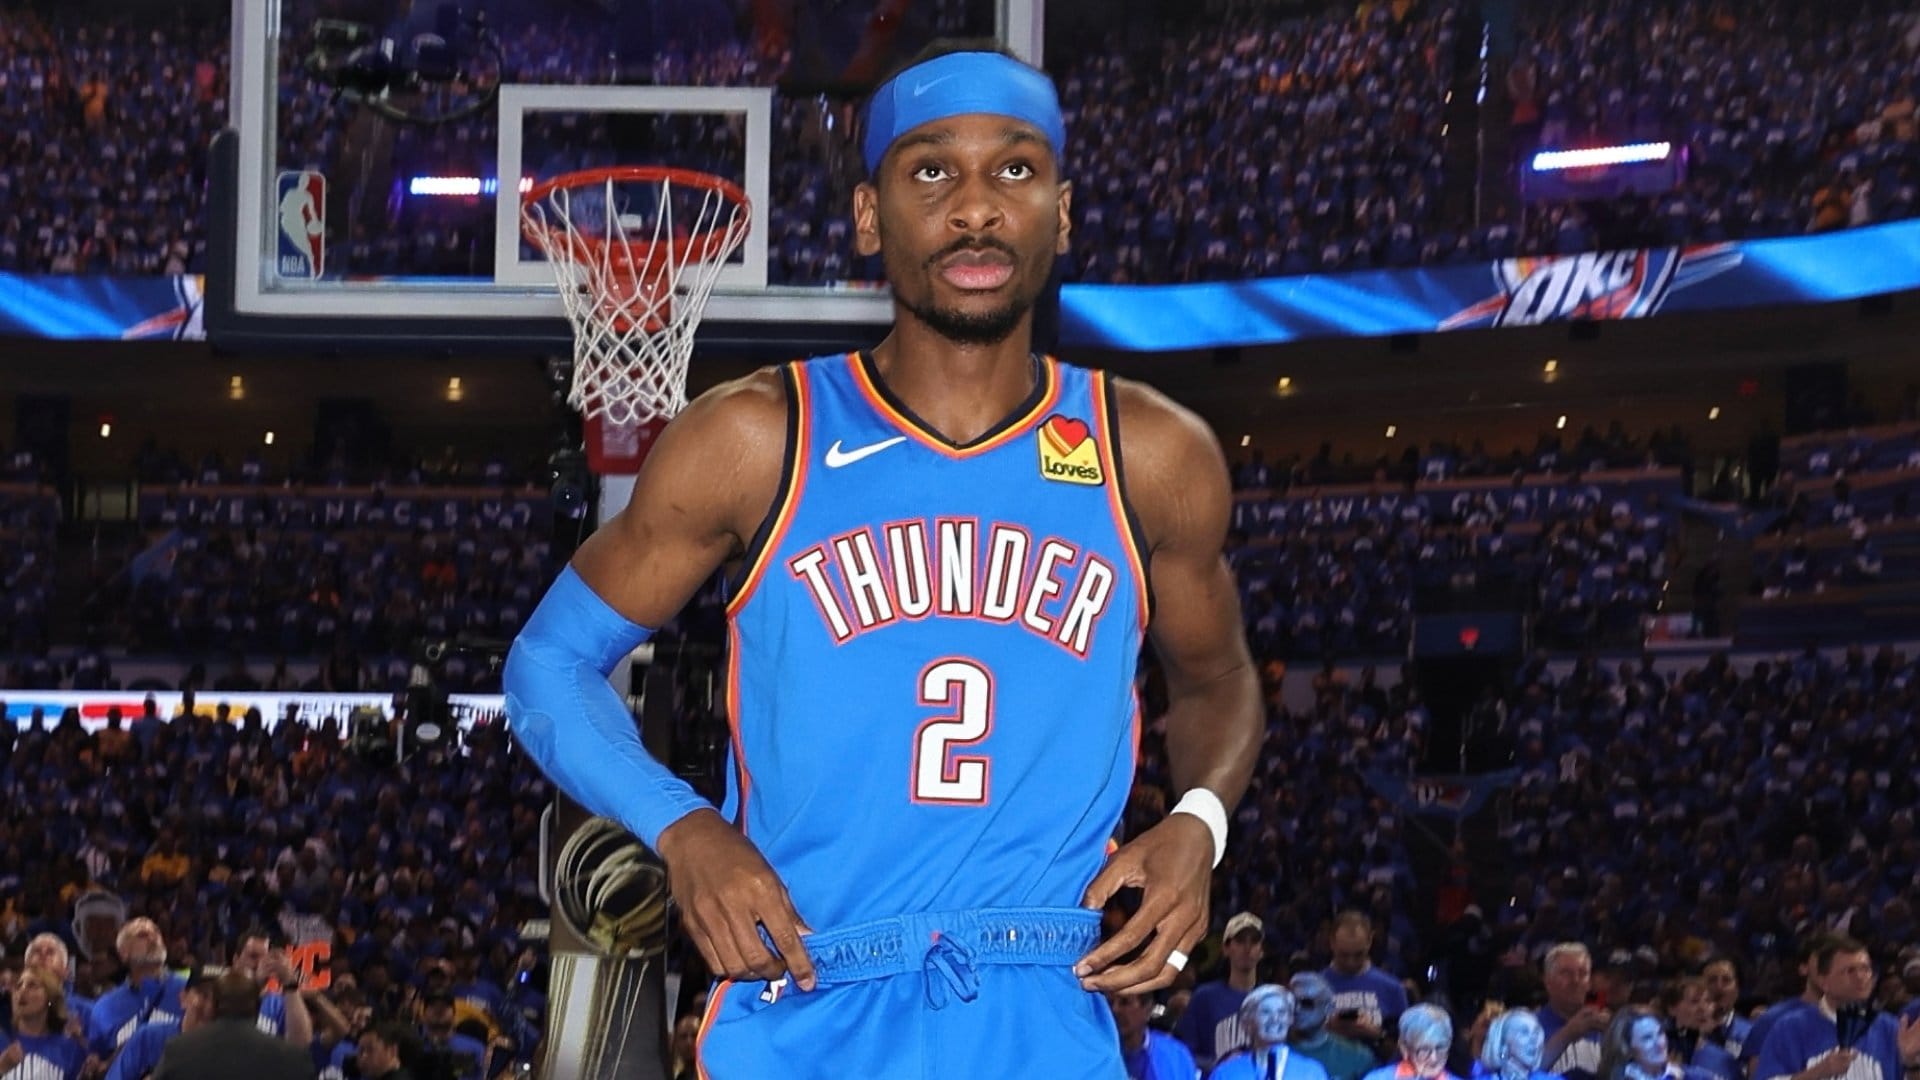
8. Shai Gilgeous-Alexander has scored more than twice as many clutch points (46) as any other player.
The defending champion Oklahoma City Thunder are 6-0, but four of their six games have been within five points in the last five minutes, with the first two having gone to overtime.
It’s no surprise (especially with Jalen Williams out) that they’ve called on the Kia MVP on the biggest possessions. Gilgeous-Alexander has a clutch usage rate of 47.6%, the second-highest rate among 51 players who’ve played at least 10 clutch minutes and up from 37% (eighth) last season.
He hasn’t shot great (13-for-30, including just 2-for-10 from 3-point range) in the clutch, but he’s 18-for-23 from the line and has a league-high six clutch assists without a turnover. Gilgeous-Alexander (3-for-6) and Houston’s Alperen Sengun (3-for-6) are tied for the league lead in buckets to tie or take the lead in the final minute of the fourth quarter or overtime.
The champs will look to remain unbeaten when they host the Pelicans on Sunday afternoon (3:30 p.m. ET, NBA League Pass).
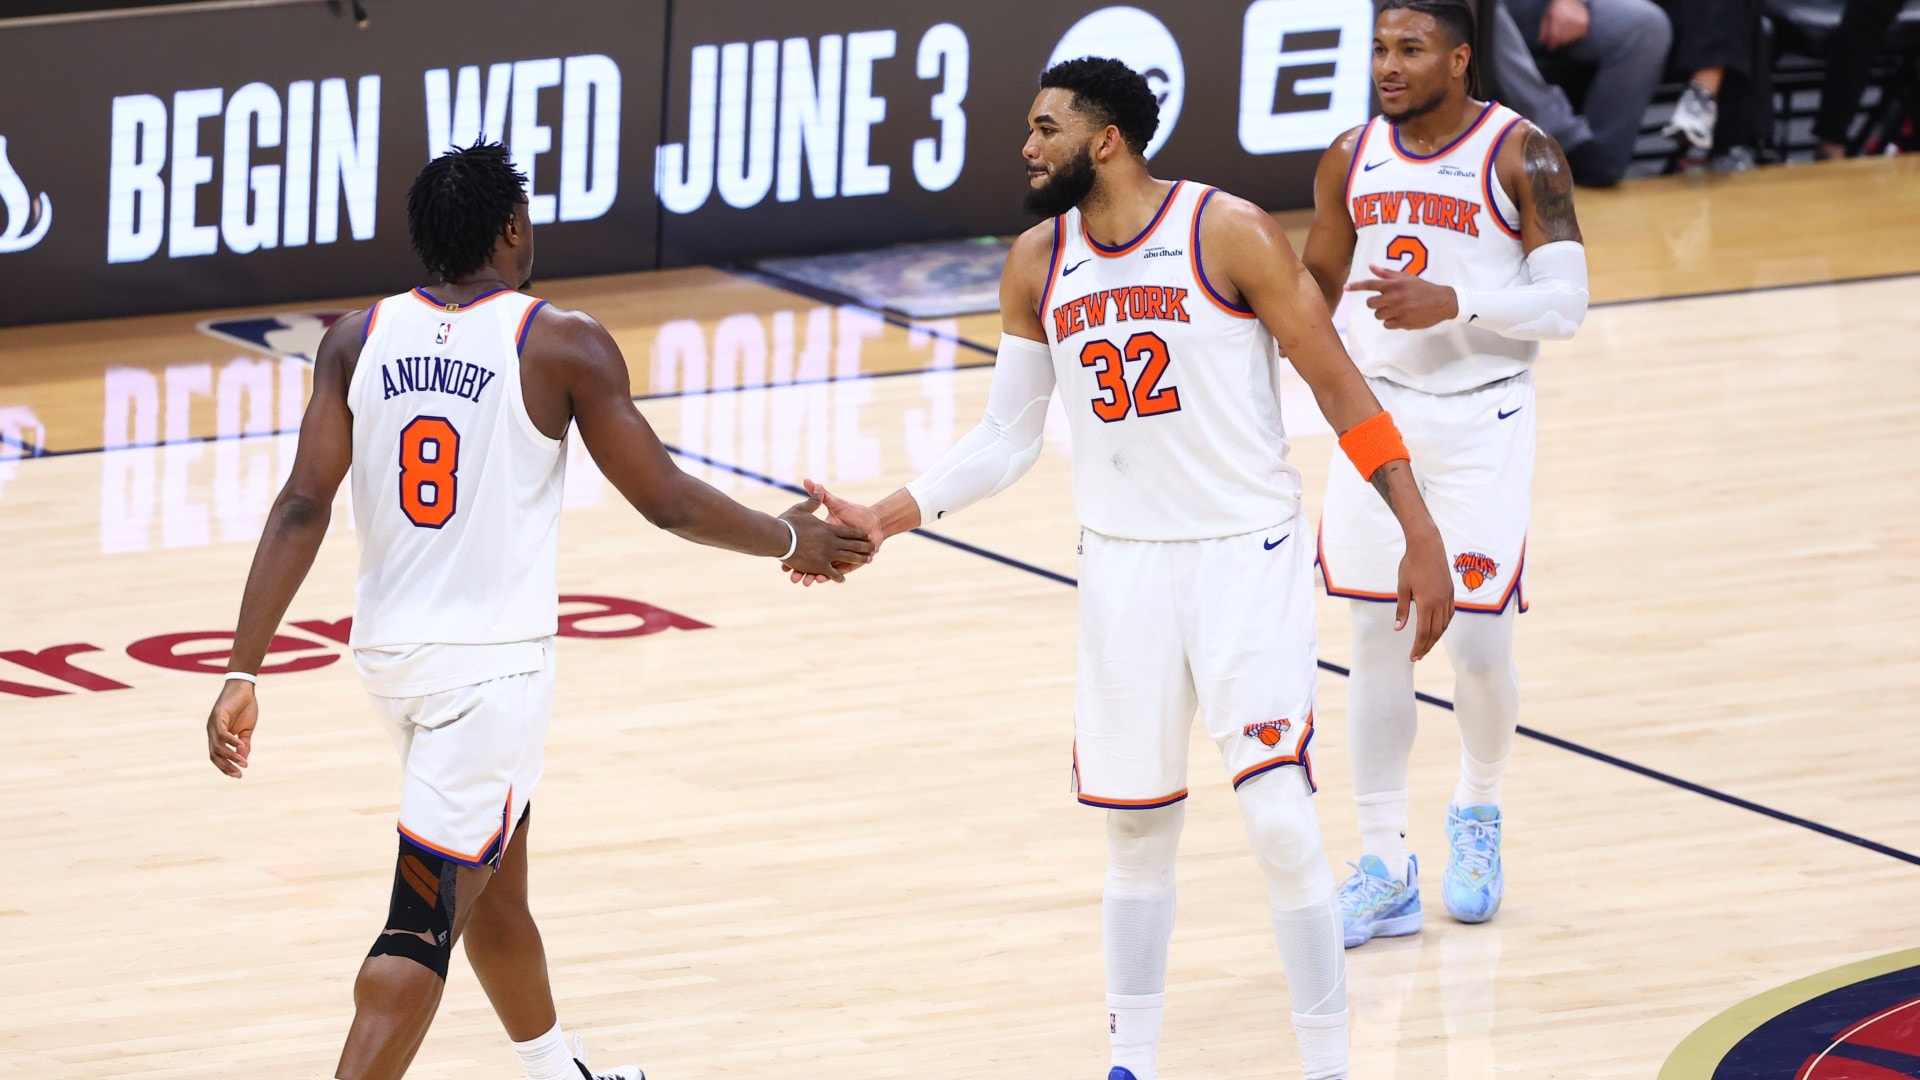
9. The Knicks have taken 49.4% of their shots from 3-point range.
That’s the league’s third-highest rate and up from 38.2% (28th) last season.
Overall, the league has taken a lower percentage of its shots from 3-point range (41.7%) than it did last season (42.1%), with 16 of the 30 teams seeing drops. The Knicks, under new coach Mike Brown, have seen the biggest jump by a huge margin …
Biggest jumps, 3PA/FGA
| TEAM | 2024-25 | Rank | 2025-26 | Rank | Diff. |
|---|---|---|---|---|---|
| New York | 38.2% | 28 | 49.4% | 3 | +11.3% |
| Cleveland | 45.7% | 4 | 50.4% | 2 | +4.7% |
| Phoenix | 44.0% | 9 | 48.6% | 5 | +4.6% |
| LA Clippers | 38.7% | 25 | 42.3% | 14 | +3.6% |
| Portland | 41.8% | 17 | 45.4% | 8 | +3.5% |
The change in shot diet hasn’t yet worked out for the Knicks, who rank 24th offensively, having seen the league’s fifth biggest drop in points scored per 100 possessions from last season. The three Knicks with the most 3-point attempts — OG Anunoby, Jalen Brunson and Karl-Anthony Towns — are a combined 28-for-87 (32.2%) from beyond the arc.
They’ll try to get the offense back on track when they visit the Bulls on Friday (8 p.m. ET, NBA League Pass).
10. The Western Conference is 12-6 against the East.
We’re on our way to the West having a better record for the 24th time in the last 27 seasons. The West’s best record in that stretch was in 2003-04, when it went 266-154 (.633) against the East and the Utah Jazz missed the playoffs with a record (42-40) that would have had them tied for fourth place in the other conference.
It’s early, the West is 9-0 against the Nets (0-2), Pacers (0-4) and Raptors (0-3), while the Thunder (3-0) and Spurs (3-0), account for half of the 12 total wins. But the standings could end up as lopsided as they were 22 years ago.
* * *
John Schuhmann has covered the NBA for more than 20 years. You can e-mail him here, find his archive here and follow him on Bluesky.