Power Rankings

Offseason Power Rankings: Thunder clear favorites to repeat in West

Get a team-by-team look at where all 15 squads in the Western Conference rank after the 2025 offseason.

The Nuggets and Thunder look like the early favorites to be the class of the West in 2025-26.

• Download the NBA App
• 2025 Free Agent Tracker
• Every reported deal for all 30 teams

The Western Conference wasn’t quite as deep as we thought it might be at the start of last season, but it still won 55% of its games against the East, its third-best mark in the last 10 years. The West was clearly the better conference.

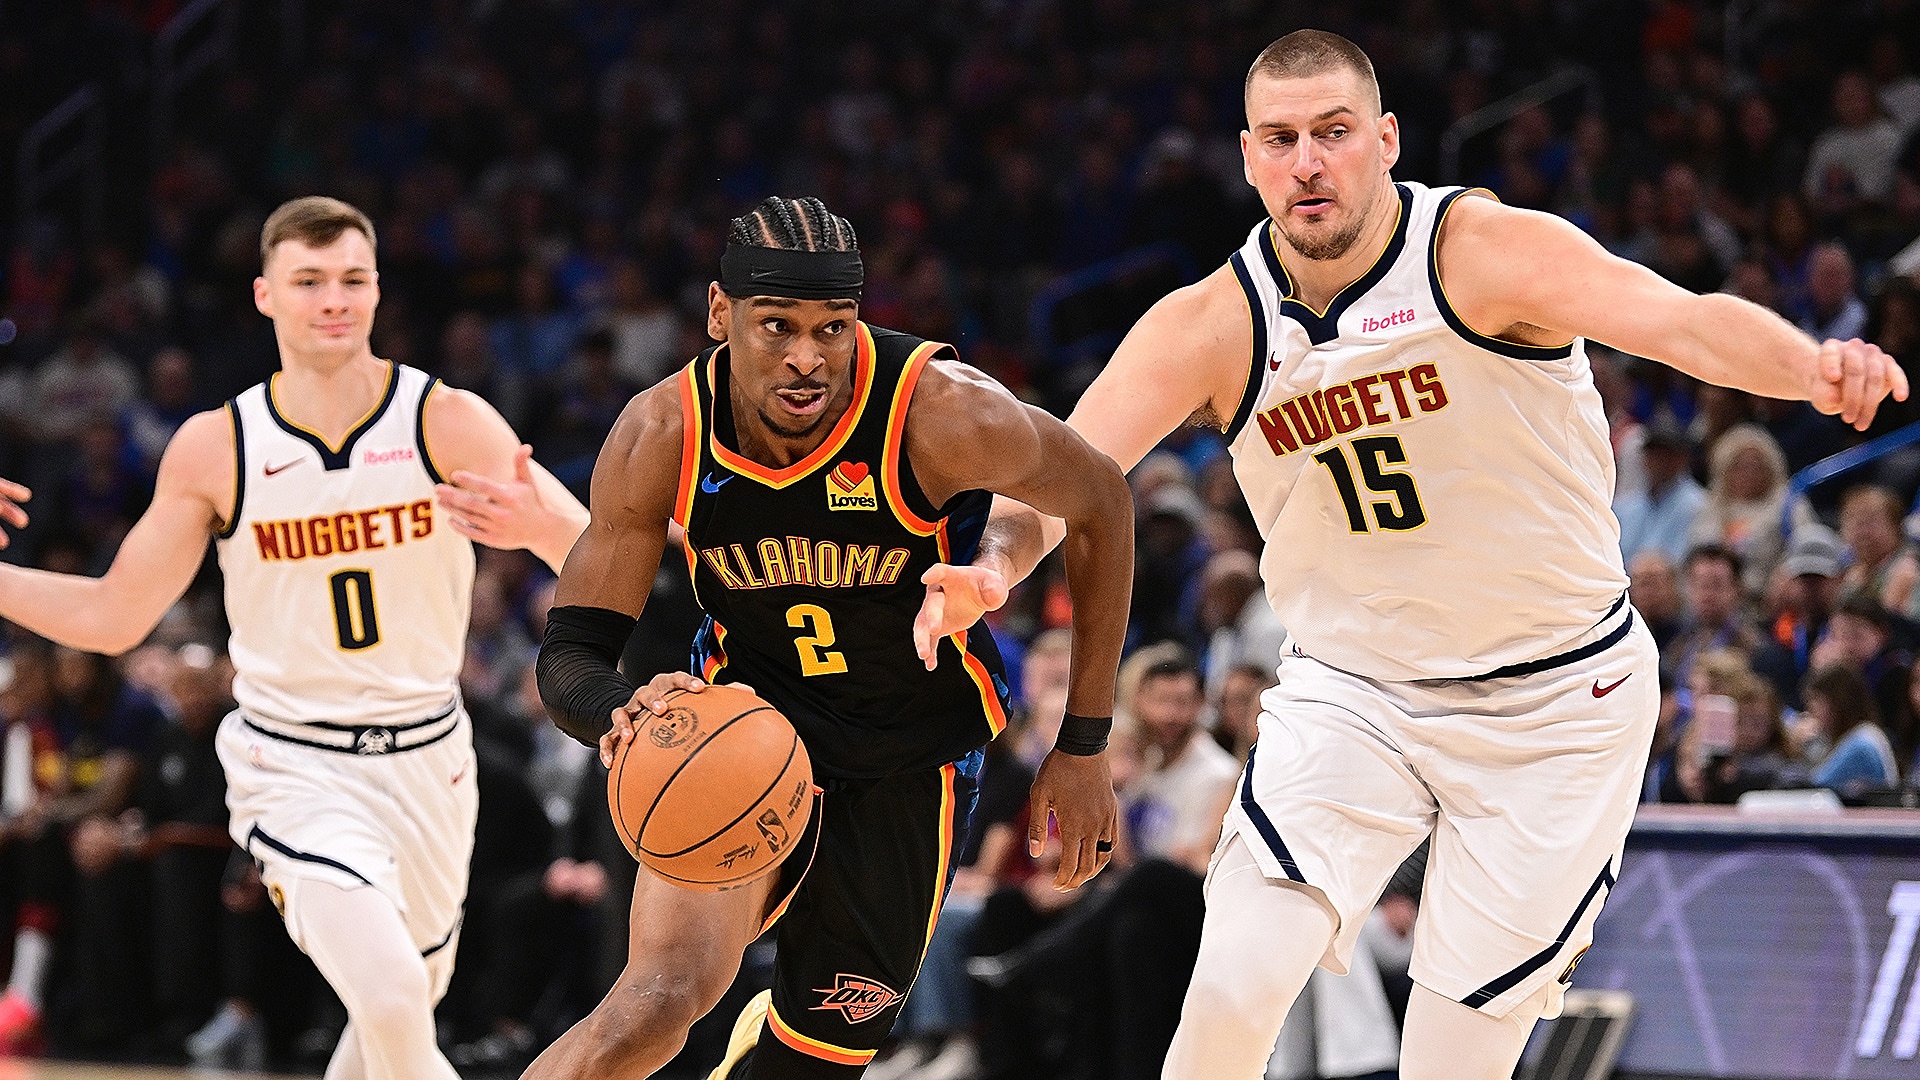
The Oklahoma City Thunder won the West by 16 games before winning their first title as the youngest champions in the last 48 years.

Was that the start of a dynasty? The Thunder are surely the favorites to win again in 2025-26, but their run through the playoffs wasn’t nearly as dominant as their regular season, and the West seems to have gotten better this summer. The second-place Houston Rockets added Kevin Durant, the third-place Los Angeles Lakers will have (a slimmer) Luka Dončić for a full season, and the Denver Nuggets (the team that took the Thunder to seven games) also made some upgrades.

There are still some offseason moves to be made, especially in San Francisco. But the time is now to take stock of the Western Conference, ranking all 15 teams as they stand, with the usual notes and numbers.

For these offseason rankings, we’re looking at each conference separately, with the Eastern Conference rankings available as well. All stats refer to the 2024-25 regular season unless otherwise noted. Last week’s rank is based on how teams finished in the playoffs, Play-In and regular season.

Previously…


OffRtg: Points scored per 100 possessions (League Rank)
DefRtg: Points allowed per 100 possessions (League Rank)
NetRtg: Point differential per 100 possessions (League Rank)
Pace: Possessions per 48 minutes (League Rank)

The league averaged 113.7 points scored per 100 possessions and 99.6 possessions (per team) per 48 minutes last season.


NBA.com’s Power Rankings, released every Monday during the season, are just one man’s opinion. If you have an issue with the rankings, or have a question or comment for John Schuhmann, send him an e-mail or contact him via threads.


Last Week:1

2024-25 record: 68-14

OffRtg: 119.2 (3) DefRtg: 106.6 (1) NetRtg: +12.7 (1)

Key additions: N/A

Key departures: N/A

Three numbers to know …

  • Over their 105 games (regular season and playoffs combined), the Thunder outscored their opponents by 1,243 points, the largest cumulative point differential for any team in NBA history. Their differential of 11.8 points per game ranks fourth all-time and the 71 regular-season games they led by double-digits were the most for any team in the 29 seasons for which we have play-by-play data.
  • They were 18-10 (.643) in games they trailed by double-digits, the best mark for any team in the 29 seasons of play-by-play data.
  • They ranked *second in opponent field goal percentage in the restricted area (63.1%) and first in the (lowest) percentage of their opponents’ shots that came in the restricted area (23%). Opponents shot just 88-for-200 (44%) at the rim when Chet Holmgren was there to protect it. That was the best rim-protection mark for any player (minimum 200 field goal attempts) in the 12 years of tracking data.

* Using only road games to account for shot-location discrepancies from arena to arena.

Key question: How do they stay fresh?

The Thunder aren’t just running it back, leading the league in continuity, with 95% of their 2024-25 regular season minutes (and 99% of their playoff minutes) represented by players still on the roster. Their entire rotation is under contract (a few guys have team options) for 2026-27 as well. The title picture isn’t quite at the level where we ask “Thunder or the field?,” but it might get there if they’re as dominant as they were last season. It’s always easier to pick a team to win the championship when they’ve done it before.

But it’s now been seven years since a team won two straight titles. The Thunder, considering their youth and potential improvement from Holmgren and Jalen Williams, are well-suited to break that streak. It’s a long season and the Thunder may need to take their foot off the gas at some point to ensure they make it to a second straight June.

Last Week:3

2024-25 record: 50-32

OffRtg: 118.9 (4) DefRtg: 115.1 (21) NetRtg: +3.8 (9)

Key additions: Cam Johnson, Jonas Valančiūnas

Key departures: Michael Porter Jr., Russell Westbrook

Three numbers to know …

  • The Nuggets have ranked in the top seven offensively in each of the last nine seasons, with last season (when they scored 5.2 points per 100 possessions more than the league average) being their best offensive season in that stretch. But it was also their worst defensive season (1.4 allowed more than average) in the last seven years.
  • They averaged 57.6 points in the paint per 100 possessions, the most for any team in the last 12 seasons. They ranked first in field goal percentage in the paint (60.9%) and second in the percentage of their shots that came in the paint (54%), with the Knicks (eighth and ninth) being the only other team that ranked in the top 10 in both.
  • Aaron Gordon shot 75-for-172 (43.6%) from 3-point range, up from 29.0% in 2023-24. That was the biggest jump among 215 players with at least 100 3-point attempts in each of the last two seasons. Christian Braun saw the second biggest jump in effective field goal percentage (from 52.5% to 63.4%) among 214 players with at least 300 field goal attempts in each of the last two seasons.

Key question: Should they increase the 3-point volume?

The flip side of the Nuggets’ paint dominance is that they were outscored from 3-point range in a league-high 55 games. They were one of four teams – the Thunder, Rockets and Pacers were the others – with a winning record (28-27) when they were outscored from beyond the arc, but it would be good if they could keep up with their opponent’s perimeter shooting more often. Do the math: They were 22-5 when they weren’t outscored from deep.

Valančiūnas should help with the minutes when Nikola Jokić is off the floor. The Nuggets have been outscored by 9.2 points per 100 possessions in minutes when Jokić rests over the last four seasons. When he’s on the floor, the three-time MVP gives Denver a matchup advantage against every opponent. In each of the two seasons since they won their title, the Nuggets have been the toughest opponent for the eventual champions.

Last Week:5

2024-25 record: 52-30

OffRtg: 114.9 (12) DefRtg: 110.3 (5) NetRtg: +4.6 (7)

Key additions: Kevin Durant, Dorian Finney-Smith, Clint Capela

Key departures: Dillon Brooks, Jalen Green

Three numbers to know …

  • The Rockets averaged 5.5 more shooting opportunities (field foal attempts or trips to the line) than their opponents, the league’s biggest differential by a healthy margin. They led the league in offensive rebounding percentage by a huge margin and averaged 18.1 second-chance points per game, second most for any team in the 29 seasons that second-chance points have been tracked.
  • According to Second Spectrum tracking, their defense allowed 51.4 drives per 100 possessions, most of any team. But they allowed the second-fewest points per chance (0.97) when a drive led directly to a shot, turnover or trip to the line.
  • Last season marked Durant’s 14th season in which he averaged at least 25 points per game with a true shooting percentage of 60% or better. That’s five more seasons than any other player in NBA history, with LeBron James (nine) and Stephen Curry (eight) next on the list.

Key question: Is there enough shooting?

The Rockets certainly needed a bucket-getter like Durant. They ranked 10th offensively (115.2 points scored per 100 possessions) in non-clutch situations, but scored 8.6 fewer per 100 (only four teams saw a bigger drop-off) when the score was within five points in the last five minutes of the fourth quarter or overtime. If the defense could contain the Fred VanVleet-Alperen Sengun pick-and-roll, the Rockets struggled to get good (initial) shots down the stretch.

There’s still not a ton of shooting around Durant, with Finney-Smith and Aaron Holiday being the only other Rockets who shot the league average or better on at least 100 3-point attempts last season. It will be critical for VanVleet to shoot closer to his mark from 3-point range in his first season in Houston (38.7%) than last season’s (34.5%).

Last Week:2

2024-25 record: 49-33

OffRtg: 115.7 (8) DefRtg: 110.8 (6) NetRtg: +5.0 (4)

Key additions: N/A

Key departure: Nickeil Alexander-Walker

Three numbers to know …

  • The Wolves led the league with 46 games that were within five points in the last five minutes. They were 20-26 (.435) in those clutch games and 29-7 (.806) otherwise, with that being the league’s biggest such differential. Overall, they were 49-33 with the point differential of a team that was 55-27.
  • They were one of two teams — the Cavs were the other  — to rank in the top six in both 3-point percentage (37.7%, fourth) and 3-point rate (45.5% of their shots, sixth). They saw the league’s second biggest jump from 2023-24 in the latter, with Anthony Edwards seeing the third biggest jump in 3-point rate (from 34.1% to 50.3%) among 130 players with at least 500 field goal attempts in both seasons.
  • Their starting lineup outscored opponents by 17 points per 100 possessions (allowing less than a point per possession) in its 186 playoff minutes. That was the best mark for any lineup that played at least 100 playoff minutes in the last three years.

Key question: Is Rob Dillingham ready?

Alexander-Walker played in all 195 of the Wolves’ games over the last two years, averaging 24.4 minutes. With his departure and with Mike Conley turning 38 in October, there’s a serious need for a new contributor in the backcourt. Terrence Shannon Jr. had a nice run of rotation minutes in February and Donte DiVincenzo will likely see an increase in minutes.

But Dillingham (the No. 8 pick in last year’s Draft) can provide more (and needed) juice off the dribble if he’s ready to contribute. His 13.0 drives per 36 minutes last season were more than double the rate of DiVincenzo (6.9 per 36). The 20-year-old played just 16 total minutes in the playoffs, and defense could be an issue when he’s at the point of attack. But he should have a big opportunity to earn a big role in his second season.

Last Week:6

2024-25 record: 50-32

OffRtg: 114.3 (15) DefRtg: 109.4 (15) NetRtg: +4.9 (5)

Key additions: Bradley Beal, John Collins, Brook Lopez, Chris Paul

Key departure: Norman Powell

Three numbers to know …

  • The Clippers allowed 4.3 fewer points per 100 possessions than the league average, making last season their best defensive season, by far, in the 29 years for which we have play-by-play data. They led the league in defensive rebounding percentage after ranking 24th the season prior.
  • They ranked 29th in ball movement (299 passes per 24 minutes of possession) and 30th in player movement (10.5 miles traveled per 24 minutes of possession), according to Second Spectrum tracking. They also ranked last in the percentage of their 3-point attempts (60%) that were off the catch.
  • They ranked just 25th in 3-point rate (38.7% of their shots), but had the league’s biggest differential (by a wide margin) between their record when they shot the league average (36.0%) or better from 3-point range (39-6, .867) and their record when they shot worse (11-26, .297).

Key question: How valuable is depth?

The Clippers are old, but are 11-deep with competent vets, meaning they’ll still have eight when three aren’t available. In the backcourt, Paul takes some of the playmaking burden off James Harden, who last season had a usage rate of 28.6%, his highest since his last full season in Houston. Only 13% of Harden’s 3-point attempts were wide open, with that being the lowest rate among 197 players with at least 200 attempts, according to Second Spectrum tracking.

The added depth up front may be most valuable. The Clippers were 12.8 points per 100 possessions better with Ivica Zubac on the floor (plus-9.4) than they were with him off the floor (minus-3.4) last season. That was the fourth-biggest differential among 253 players who played at least 1,000 minutes for a single team and the Clippers lost nine games (plus Game 4 of their series vs. Denver) in which they outscored their opponent with Zubac on the floor. Lopez is now 37, but he’s played 78 games or more in each of the last three seasons, and he gives the Clippers a different offensive profile at the five, while still providing rim protection.

Last Week:7

2024-25 record: 50-32

OffRtg: 115.0 (11) DefRtg: 113.8 (17) NetRtg: +1.2 (14)

Key additions: Deandre Ayton, Jake LaRavia, Marcus Smart

Key departure: Dorian Finney-Smith

Three numbers to know …

  • The Lakers had the league’s biggest differential between their record at home (31-10, third best) and their record on the road (19-22, 16th).
  • They also had the biggest differential between their record when they led at the half (43-7, fourth best) and when they trailed at the half (6-24, 19th). They were 11.6 points per 100 possessions better before halftime (plus-6.9, fourth) than they were in the second half (minus-4.7, 25th). That was the league’s biggest half-to-half differential.
  • For the third straight season, they led the league in free-throw differential, outscoring their opponents by 2.3 points per game at the line. But that was half their differential from the season prior (plus-4.6).

Key question: Will LeBron James fit in?

The Lakers were outscored in 742 total minutes (regular season and playoffs combined) with Luka Dončić and James on the floor together, but outscored their opponents by 17.2 points per 100 possessions (scoring 124.6 per 100) in 450 total minutes with Dončić on the floor without James. James has shot 44% on catch-and-shoot 3s over the last two seasons, so it’s not like he’s a bad offensive fit alongside the guy who’s averaged a league-high 3.7 assists on 3-pointers over the last five years.

There could be bigger questions on defense, where the Lakers ranked 17th after acquiring Dončić and 12th in the first round (allowing the Wolves to score more efficiently than they did in the regular season). Ayton offers more rim protection than what they had at the end of last season and actually had the best rim-protection mark of his career last season (53.5% shooting against him at the basket), though that was in only 40 games.

Last Week:4

2024-25 record: 48-34

OffRtg: 114.2 (16) DefRtg: 111.0 (7) NetRtg: +3.2 (10)

Key addition(s): N/A

Key departure(s): Kevon Looney

Key outstanding free agent: Jonathan Kuminga

Three numbers to know …

  • In the regular season, the Warriors went 22-5 with Stephen Curry and Jimmy Butler both in the lineup, though they outscored their opponents by just 5.0 points per 100 possessions with both on the floor. That mark ranked 27th among the team’s 60 two-man combinations that played at least 250 minutes together.
  • The Warriors scored 13.4 more points per 100 possessions with Curry on the floor (118.4) than they did with him off the floor (105.0). That was the third biggest on-off differential on offense among 253 players that played at least 1,000 minutes for a single team and Curry’s biggest differential in the last seven seasons. In the playoffs, they scored 16.0 per 100 more with him on the floor than they did with him off the floor (less than a point per possession).

Key question: How do they fill out their roster?

The Warriors have the most work to do of any team, with Kuminga’s restricted free agency holding things up. It seems that the best solution for both parties would be a sign-and-trade deal, but that, of course, involves a third party. Kuminga surely wasn’t happy with his inconsistent playing time last season … and the Warriors were outscored by 15.8 points per 100 possessions in his 187 playoff minutes. Not good.

Even if Kuminga were to stay (via the qualifying offer or a new contract), there will still be four or five additional roster spots to fill. Al Horford and Gary Payton II will reportedly fill two of those spots, giving the Warriors a good chance to remain in the top 10 defensively. Taking some of the offensive burden off Curry may be a tougher task. Butler got to the line a ton, but had an effective field goal percentage of just 50.4% over his 42 games (regular season, SoFi Play-In and playoffs combined) with Golden State.

Last Week:10

2024-25 record: 39-43

OffRtg: 113.7 (18) DefRtg: 115.0 (20) NetRtg: -1.3 (19)

Key additions: Cooper Flagg, D’Angelo Russell

Key departure: Spencer Dinwiddie

Three numbers to know …

  • They saw the league’s biggest drop in the percentage of their shots that came from 3-point range, from 44.1% (second highest) in 2023-24 to 38.9% (24th) last season. P.J. Washington saw the second biggest drop (from 50.9% to 35.9%) among 130 players with at least 500 field goal attempts in both seasons.
  • The Mavs allowed 9.7 fewer points per 100 possessions with Derek Lively II on the floor (106.4) than they did with him off the floor (116.1). That was the biggest on-off differential on defense among 314 players who played at least 750 minutes for a single team. Lively played just 54 total minutes alongside Anthony Davis, with the Mavs allowing less than a point per possession in those minutes.

Key question: How much will Davis play inside?

In Davis’ nine games with the Mavs last season, he took 55% of his shots in the paint, down from 72% over his last 2 1/2 seasons with the Lakers. He’s always been one of those players with a huge differential between how effectively he shoots inside (career field goal percentage of 61.9% in the paint) vs. outside (39.3% from mid-range, 29.9% from 3-point range). The Mavs need to keep him playing big, even if he’s playing almost all of his minutes alongside Lively or Daniel Gafford.

No matter how many jumpers Davis is taking, the big frontline has the potential to be terrific defensively and on the glass. You can also imagine some lineups where the 6-foot-8 Flagg is playing a guard alongside Davis, one of the centers and either Washington or Naji Marshall. Until Kyrie Irving comes back, the Mavs will be an interesting big-ball experiment, and they might force some teams to adjust if they can dominate inside.

Last Week:8

2024-25 record: 48-34

OffRtg: 117.2 (6) DefRtg: 112.6 (11) NetRtg: +4.7 (6)

Key additions: Kentavious Caldwell-Pope, Ty Jerome, Cedric Coward

Key departures: Desmond Bane, Luke Kennard, Jay Huff

Three numbers to know …

  • The Grizzlies had the league’s biggest differential between their record against the 16 teams that finished at or below .500 (36-9, .800) and their record vs. the 14 teams that finished over .500 (12-25, .324).
  • They averaged 32.8 transition points per game, the most for any team in 21 years of Synergy tracking. They also led the league in the percentage of their possessions (69%) where the ball touched the paint, according to Second Spectrum tracking.
  • Their starting lineup — Ja Morant, Bane, Jaylen Wells, Jaren Jackson Jr. and Zach Edey — outscored opponents by 26.4 points per 100 possessions in 222 total minutes. That was the second-best mark for a lineup that played at least 200 minutes in the 18 seasons for which we have lineup data.

Key question: Was it really that bad?

On March 16 (and with just 14 games left in the regular season), the Grizzlies were tied for second place in the West at 43-25, holding the league’s fourth-best point differential (plus-5.9 per 100 possessions). And somehow, things went so bad in the next six weeks that they fired their young coach and traded one of their three best players. Bane just turned 27, and this is one of only five teams that have won 48 games or more in (at least) three of the last four seasons.

Did they take a step backward? Or can they make up for Bane’s departure with depth and the continued development of a group that’s mostly younger than him? The Grizzlies did outscore opponents by 11.9 points per 100 possessions in 372 total minutes (regular season, SoFi Play-In and playoffs combined) with Morant and Jackson Jr. on the floor without Bane last season. The defense has been consistently good and last year was the best offensive season (3.5 points per 100 possessions better than the league average) in franchise history.

Last Week:13

2024-25 record: 34-48

OffRtg: 113.5 (19) DefRtg: 116.3 (25) NetRtg: -2.8 (22)

Key additions: Dylan Harper, Carter Bryant, Luke Kornet

Key departure: Chris Paul

Three numbers to know …

  • At six years, the Spurs have the league’s second-longest active playoff drought. They’re one of three teams that have ranked in the bottom 10 defensively in each of the last three seasons.
  • Victor Wembanyama averaged 1.68 blocks per personal foul, the highest mark for any player with at least 100 total blocks in the 52 seasons that blocks have been counted, topping his own mark of 1.66 blocks per foul in 2023-24. The Spurs allowed 8.2 fewer points per 100 possessions with him on the floor (110.0) than they did with him off the floor (118.2), the biggest on-off differential on defense among full-time starters who played at least 1,000 minutes for a single team.
  • Wembanyama and De’Aaron Fox played just 120 minutes (over five games) together after Fox was acquired at the trade deadline. The Spurs were outscored by six points (2.4 per 100 possessions) over those minutes.

Key question: Will they try to get Wembanyama better shots?

Wembanyama shot 67% in the paint last season, but had an effective field goal percentage of just 50.1% on shots from outside the paint. That marks the fifth biggest differential among 152 players with at least 200 field goal attempts both in and outside the paint, but the Spurs seemed complacent with the 7-foot-3 Wembanyama taking only 37% of his shots inside. That was down from 51% in Wembanyama’s rookie season and a much lower rate than those of the four players above him on the differential list.

Biggest effective FG% difference, paint vs. outside, 2024-25

Player Paint FG% Outside eFG% Diff. % Paint
Giannis Antetokounmpo 67.2% 42.3% 24.9% 74%
Wendell Carter Jr. 60.3% 36.2% 24.1% 56%
Obi Toppin 72.6% 53.9% 18.6% 47%
Anthony Davis 59.3% 42.4% 16.9% 66%
Victor Wembanyama 67.0% 50.1% 16.9% 37%

Minimum 200 FGA both in and outside the paint (152 players)
eFG% = (FGM + (0.5 * 3PM)) / FGA
% Paint = Percentage of FGA coming in the paint

That rate of 37% came with the offense being run by one of the best pick-and-roll passers in league history. Fox isn’t nearly the passer that Paul is, but his speed can bend the defense better than the 40-year-old at this point in their careers. Primarily, it will be up to Wembanyama himself to become more of an interior scorer. If he does that, the Spurs have the chance to make big leaps on offense and defense.

Last Week:12

2024-25 record: 36-46

OffRtg: 111.0 (22) DefRtg: 113.7 (16) NetRtg: -2.7 (21)

Key addition: Jrue Holiday, Damian Lillard

Key departures: Anfernee Simons, Deandre Ayton

Three numbers to know …

  • The Blazers were one of two teams — the Pistons were the other — who were at least two points per 100 possessions better on both ends of the floor than they were in 2023-24. They were the league’s fifth most improved team on offense and its ninth most improved on defense.
  • They saw the league’s biggest drop in opponent field goal percentage in the paint, from 61.3% (30th) in ’23-24 to 56.2% (11th) last season. Their opponents shot much worse in the paint with Donovan Clingan on the floor (53.4%) than with Ayton (58.8%).
  • Over 16 games in March and April, Deni Avdija averaged 24.9 points, 10.6 rebounds and 5.5 assists. The only other players to average at least 24, 10 and five after March 1 were Nikola Jokić and Giannis Antetokounmpo.

Key question: Is a top-10 defense possible?

Scoot Henderson and Shaedon Sharpe need to play a lot, because the Blazers need to figure out what they have in the young duo (21 and 22 years old, respectively) before Lillard comes back from his Achilles tear. Both saw jumps in efficiency last season and both still have plenty of room for improvement. Holiday is versatile enough to play alongside either one, giving the Blazers a pretty unique three-man guard rotation.

Holiday also joins a list of terrific defenders in Portland, and the departures of Simons and Ayton were addition by subtraction defensively. The Blazers had the league’s third-ranked defense (110.0 points allowed per 100 possessions) over their last 41 games last season, and they certainly have the potential for more defensive success, especially if Holiday can teach the young guards a thing or two.

Last Week:9

2024-25 record: 40-42

OffRtg: 115.9 (7) DefRtg: 115.3 (22) NetRtg: +0.6 (15)

Key addition: Dennis Schröder

Key departures: Jonas Valančiūnas, Jake LaRavia

Key outstanding free agent: Trey Lyles

Three numbers to know …

  • The Kings had a better record under Doug Christie (27-24) than they had under Mike Brown (13-18), but they were better statistically under Brown (plus-1.6 per 100 possessions, 14th) than they were under Christie (minus-0.0, 16th).
  • Zach LaVine shot 140-for-328 (43.8%) on pull-up 3-pointers, the best mark among 80 players with at least 100 attempts last season and the fourth best mark for a player with at least 200 attempts in the 12 seasons of tracking data.
  • DeMar DeRozan led the league in mid-range field goal attempts (640) for the fourth straight season and the sixth time in his career, attempting more mid-range shots by himself than the Grizzlies, Cavs or Jazz. He took 32% of his shots in the paint, by far the lowest rate of his career.

Key question: What’s the plan here?

If there’s a future timeline for the Kings, it’s not apparent. They got just 4.4% of their 2024-25 minutes from first or second-year players, which was the league’s third-lowest rate and the lowest rate among non-playoff teams. This season’s rookies — Nique Clifford and Maxime Raynaud — were taken with the 24th and 42nd picks in the Draft.

Lowest % of minutes from 1st/2nd-year players, non-playoff teams

Team Rookie MIN 2nd Year MIN Total %MIN
Sacramento 746 130 876 4.4%
Dallas 124 1,417 1,541 7.8%
Chicago 1,566 1,198 2,764 14.0%
Phoenix 2,486 482 2,968 15.0%
Atlanta 2,416 684 3,100 15.7%

% MIN = Percentage of total minutes

The current timeline doesn’t look so great, either. In 590 total minutes (regular season and SoFi Play-In combined) with LaVine, DeRozan and Domantas Sabonis on the floor together last season, the Kings were outscored by 4.8 points per 100 possessions, allowing more than 120 per 100. That’s some brutal defense, and the Kings won’t be very competitive if the numbers remain in that range going forward.

Last Week:11

2024-25 record: 36-46

OffRtg: 114.7 (13) DefRtg: 117.7 (27) NetRtg: -3.0 (23)

Key additions: Dillon Brooks, Jalen Green, Mark Williams, Khaman Maluach

Key departures: Bradley Beal, Kevin Durant, Tyus Jones, Mason Plumlee

Coaching change: Mike Budenholzer out, Jordan Ott in

Three numbers to know …

  • The Suns were 33-29 with Durant in the lineup and 3-17 without him, with two of those three wins having come against Utah. They were outscored by 8 points per 100 possessions in 1,259 minutes with Devin Booker on the floor without Durant.
  • They were outscored by 8.2 points per game in the restricted area, the league’s biggest discrepancy by a huge margin. They took just 19.9% of their shots *on the road in the restricted area, with that being the lowest rate for any team in the 29 seasons for which we have shot-location data. Their 70.9% shooting in the restricted area was the second highest mark for any team in those 29 years.

* Using only road data to account for shot-location discrepancies from arena to arena.

  • Booker (51.9%) was one of four players (Durant was another) who shot better than 50% on at least 200 pull-up 2-pointers. But he shot just 93-for-303 (30.7%), his worst mark in the last six seasons, on pull-up 3-pointers. That was the biggest differential among 62 players who attempted at least 100 pull-up 2s and at least 100 pull-up 3-pointers.

Key question: Can Booker and Green play together?

The Suns’ two highest-paid players are an interesting mix, and if the Suns are going to put their best players on the floor, they’ll be playing without a real point guard (which sounds familiar). Will Booker and Green — both of whom can create their own shot — get the Suns some easy baskets in transition? It will be fascinating to see how often they assist each other relative to the league’s other guard combinations.

It would be good if Green (and the Suns as a whole) could put a little more pressure on the rim than he did last season. In 2024-25, his 11.5 drives per 36 minutes ranked 68th among 375 players who played at least 500 minutes. That wasn’t far ahead of Beal, who ranked 75th at 11 drives per 36.

Green and Williams are still just 23 years old, while Ryan Dunn is 22. There’s a next phase of the Suns coming, and this season could tell us how close those three guys are to their ceiling.

Last Week:14

2024-25 record: 21-61

OffRtg: 109.7 (25) DefRtg: 119.1 (29) NetRtg: -9.4 (29)

Key additions: Jordan Poole, Kevon Looney, Jeremiah Fears, Derik Queen

Key departures: CJ McCollum, Bruce Brown

Three numbers to know …

  • The Pelicans were just the second team in the 29 seasons for which we have play-by-play data (joining the 2010-11 Cavs) to be at least six points per 100 possessions worse on both ends of the floor than they were the season prior.
  • They were the only team with a losing record in games they led at the half. Their 10-17 (.370) record when leading at the half was the worst mark for any team in the last six years.
  • Zion Williamson averaged 23.9 points in the paint per 36 minutes, the most for any player (minimum 500 minutes played) in the 29 seasons for which we have shot-location data, topping his mark of 22 per 36 in 2020-21. Over his career, 95.4% of his shots have come in the paint.

Key question: Which of the last two seasons was more real?

In 2023-24, the Pelicans were 49-33 with a point differential of a team that was 54-28. Last season, they saw the third biggest season-to-season drop-off (14.0 points per 100 possessions) in the last 26 years. Much of that was injuries, but they were also outscored by 1.3 per 100 in 667 total minutes with any three of McCollum, Williamson, Herb Jones or Trey Murphy III on the floor. Even when they were somewhat healthy, they weren’t very good.

The Pelicans rank last in continuity, with a little less than 50% of their 2024-25 minutes represented by players still on the roster, so this is somewhat of a reboot. The core got younger with the McCollum-for-Poole swap, but Williamson is still the focal point (and still only 25 years old), while Jones (27 in October) and Murphy (25) are still their best two-way players. If they can’t rediscover some of that ’23-24 success, more changes may be coming.

Last Week:15

2024-25 record: 17-65

OffRtg: 110.2 (24) DefRtg: 119.4 (30) NetRtg: -9.2 (28)

Key additions: Ace Bailey, Walter Clayton Jr., Kyle Anderson, Jusuf Nurkić

Key departures: Jordan Clarkson, John Collins, Collin Sexton

Three numbers to know …

  • The Jazz committed 5.4 more turnovers than their opponents, the worst differential for any team in the 48 seasons in which turnovers have been counted by a wide margin. (Next worst is 4.3 more per game.) They ranked last in turnover rate (17.0 per 100 possessions), opponent turnover rate (11.6 per 100) and deflections per game (13.3).
  • Brice Sensabaugh had an effective field goal percentage of 59%, up from 46.8% in 2023-24 (his rookie season). That was the biggest jump among 254 players with at least 200 field goal attempts in each of the last two seasons. Sensabaugh was one of four players to shoot better than 50% on at least 100 corner 3-point attempts.

Key question: Is there a starter in the backcourt?

The Jazz’s most reliable and most intriguing players are all in the frontcourt, and it will be especially interesting to see what they have in Taylor Hendricks, who’s still just 21 years old, having played just 930 total minutes since being selected with the No. 9 pick in 2023. Kyle Filipowski was a second-rounder, but averaged 20.2 points and 11.4 rebounds per 36 minutes after the All-Star break last season.

The backcourt looks relatively shallow. Keyonte George didn’t show much progress in Year 2 and is one of five players with an effective field goal percentage below 50% on at least 500 field goal attempts in each of the last two seasons. Isaiah Collier is a steadier hand, but was an even worse shooter than George. Clayton (the 18th pick this year) is another bite at the apple as the Jazz try to find a guard who can run the offense with some efficiency.

Latest